Introduction
GPU observability and profiling tools help teams monitor, analyze, and optimize GPU performance across workloads such as AI training, inference, high-performance computing, and data processing. These tools provide visibility into GPU utilization, memory usage, kernel execution, bottlenecks, and system-level behavior.
As GPU workloads grow in complexity, especially in AI and machine learning pipelines, understanding performance at a granular level becomes critical. Without proper observability, organizations risk underutilized hardware, performance bottlenecks, and increased infrastructure costs.
Common use cases include performance tuning for AI models, debugging GPU bottlenecks, monitoring multi-GPU clusters, optimizing inference pipelines, and improving system efficiency.
Best for: AI engineers, ML teams, data scientists, DevOps engineers, platform teams, and enterprises running GPU-intensive workloads.
Not ideal for: Small teams without GPU workloads or users running simple CPU-based applications where GPU profiling is unnecessary.
Key Trends in GPU Observability & Profiling Tools
- Increasing demand for real-time GPU monitoring across clusters
- Integration with ML workflows and training pipelines
- Rise of cloud-native GPU observability tools
- Support for multi-GPU and distributed environments
- Deeper kernel-level profiling capabilities
- Integration with observability stacks such as metrics and dashboards
- Focus on performance optimization and cost efficiency
- Improved visualization for debugging and tuning
- Growing support for heterogeneous hardware environments
- Automation in performance analysis and recommendations
How We Selected These Tools
- Strong adoption in AI and HPC ecosystems
- Coverage of profiling and observability capabilities
- Support for major GPU vendors
- Performance analysis depth and accuracy
- Integration with ML frameworks and infrastructure
- Ease of use for developers and engineers
- Scalability for cluster and cloud environments
- Active development and ecosystem support
- Documentation quality and community strength
- Suitability across different user segments
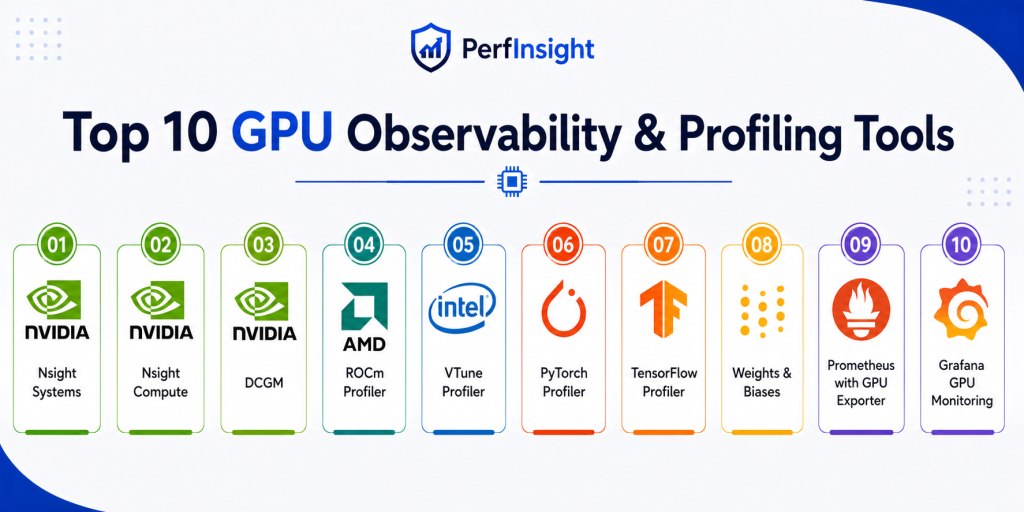
Top 10 GPU Observability & Profiling Tools
1. NVIDIA Nsight Systems
Short description:
NVIDIA Nsight Systems is a system-wide performance analysis tool designed to provide detailed insights into GPU and CPU interactions. It helps developers visualize execution timelines and identify bottlenecks in complex workloads. The tool is widely used in AI, HPC, and graphics applications. It is best suited for deep performance analysis at system level.
Key Features
- System-wide performance timeline
- CPU and GPU interaction tracing
- Multi-process profiling
- Visualization tools
- API tracing support
- Cross-platform profiling
- Detailed performance metrics
Pros
- Deep system-level insights
- Strong visualization capabilities
- Ideal for complex workloads
Cons
- Steep learning curve
- Heavy tool for beginners
- Requires NVIDIA GPUs
Platforms / Deployment
Windows / Linux
Deployment: Desktop tool
Security & Compliance
Not publicly stated
Integrations & Ecosystem
Nsight Systems integrates closely with NVIDIA tools and GPU ecosystems.
- CUDA tools
- AI frameworks
- Developer workflows
- Profiling pipelines
- HPC environments
- GPU clusters
Support & Community
Strong documentation and enterprise-level support from NVIDIA
2. NVIDIA Nsight Compute
Short description:
NVIDIA Nsight Compute is a kernel-level profiling tool designed to analyze GPU compute workloads in detail. It helps developers optimize CUDA kernels and improve performance efficiency. The tool provides in-depth metrics and performance counters. It is ideal for CUDA developers and performance engineers.
Key Features
- Kernel-level profiling
- Performance metrics
- Memory analysis
- Occupancy analysis
- Detailed reports
- CUDA optimization insights
- Custom profiling configurations
Pros
- Deep kernel insights
- Accurate performance metrics
- Essential for CUDA tuning
Cons
- Requires CUDA knowledge
- Limited to NVIDIA GPUs
- Complex for beginners
Platforms / Deployment
Windows / Linux
Deployment: Desktop tool
Security & Compliance
Not publicly stated
Integrations & Ecosystem
Works with CUDA ecosystem and NVIDIA development tools.
- CUDA SDK
- AI frameworks
- HPC systems
- Developer tools
- Profiling workflows
- Performance pipelines
Support & Community
Strong technical documentation and developer community
3. NVIDIA DCGM
Short description:
NVIDIA Data Center GPU Manager is designed for monitoring and managing GPUs in data center environments. It provides telemetry, health monitoring, and diagnostics for GPU clusters. It is widely used in enterprise and cloud environments. It is ideal for infrastructure and operations teams.
Key Features
- GPU health monitoring
- Telemetry data collection
- Cluster management
- Diagnostics tools
- Alerting support
- Performance metrics
- Multi-GPU support
Pros
- Enterprise-grade monitoring
- Scales across clusters
- Reliable telemetry
Cons
- Requires setup and configuration
- Limited visualization
- NVIDIA-only
Platforms / Deployment
Linux
Deployment: Data center and cluster environments
Security & Compliance
Not publicly stated
Integrations & Ecosystem
Integrates with monitoring and observability stacks.
- Kubernetes
- Monitoring systems
- Metrics pipelines
- Cloud environments
- GPU clusters
- Infrastructure tools
Support & Community
Strong enterprise support and documentation
4. AMD ROCm Profiler
Short description:
AMD ROCm Profiler is a performance profiling tool designed for AMD GPUs. It helps analyze GPU workloads, memory usage, and execution performance. It is part of the ROCm ecosystem for high-performance computing. It is best for teams using AMD GPU infrastructure.
Key Features
- GPU performance profiling
- Memory analysis
- Kernel execution tracking
- ROCm integration
- Performance metrics
- Visualization tools
- Debugging support
Pros
- Strong AMD support
- Detailed performance insights
- Open ecosystem
Cons
- Limited outside AMD ecosystem
- Smaller community
- Setup complexity
Platforms / Deployment
Linux
Deployment: ROCm environment
Security & Compliance
Not publicly stated
Integrations & Ecosystem
Works within AMD ROCm ecosystem.
- ROCm stack
- HPC workloads
- AI frameworks
- GPU environments
- Performance tools
- Developer workflows
Support & Community
Growing community and documentation
5. Intel VTune Profiler
Short description:
Intel VTune Profiler is a performance analysis tool that supports CPU and GPU profiling. It helps developers identify bottlenecks and optimize applications. It is widely used for performance tuning across heterogeneous systems. It is suitable for developers working with Intel hardware.
Key Features
- CPU and GPU profiling
- Performance hotspots analysis
- Memory and threading insights
- Cross-platform support
- Visualization tools
- Optimization recommendations
- Multi-language support
Pros
- Supports multiple hardware types
- Strong analysis capabilities
- Good visualization
Cons
- Best with Intel hardware
- Complex interface
- Learning curve
Platforms / Deployment
Windows / Linux
Deployment: Desktop tool
Security & Compliance
Not publicly stated
Integrations & Ecosystem
Integrates with Intel development tools and environments.
- Intel toolchain
- Developer IDEs
- HPC systems
- AI frameworks
- Performance pipelines
- Debugging tools
Support & Community
Strong enterprise and developer support
6. PyTorch Profiler
Short description:
PyTorch Profiler is a built-in profiling tool for PyTorch workloads. It helps developers analyze model performance and optimize training and inference. It provides insights into GPU usage and execution time. It is ideal for ML engineers working with PyTorch.
Key Features
- Model performance profiling
- GPU utilization tracking
- Execution timeline
- Memory usage insights
- Integration with training loops
- Visualization support
- Debugging tools
Pros
- Easy integration with PyTorch
- Useful for ML workflows
- Lightweight
Cons
- Limited outside PyTorch
- Less system-level visibility
- Requires ML context
Platforms / Deployment
Cross-platform
Deployment: Integrated library
Security & Compliance
Not publicly stated
Integrations & Ecosystem
Works directly within PyTorch ecosystem.
- PyTorch
- ML pipelines
- Training workflows
- TensorBoard
- Debugging tools
- AI environments
Support & Community
Large ML community support
7. TensorFlow Profiler
Short description:
TensorFlow Profiler provides performance insights for TensorFlow models. It helps analyze training steps, GPU utilization, and bottlenecks. The tool is integrated within TensorFlow workflows. It is best for teams using TensorFlow for ML development.
Key Features
- Training performance analysis
- GPU utilization metrics
- Step-time breakdown
- Visualization tools
- Memory tracking
- Debugging insights
- Integration with TensorBoard
Pros
- Native TensorFlow integration
- Useful for ML optimization
- Good visualization
Cons
- Limited to TensorFlow
- Less flexibility
- Requires ML expertise
Platforms / Deployment
Cross-platform
Deployment: Integrated library
Security & Compliance
Not publicly stated
Integrations & Ecosystem
Integrated with TensorFlow tools and pipelines.
- TensorFlow
- TensorBoard
- ML workflows
- Training pipelines
- AI systems
- Debugging tools
Support & Community
Strong ML ecosystem support
8. Weights & Biases
Short description:
Weights and Biases is an ML observability platform that provides experiment tracking and performance monitoring. It helps teams analyze GPU usage alongside model metrics. It is widely used in AI workflows. It is best for ML teams needing end-to-end visibility.
Key Features
- Experiment tracking
- GPU utilization monitoring
- Visualization dashboards
- Collaboration tools
- Model performance tracking
- Logging and analytics
- Integration with ML frameworks
Pros
- Strong visualization
- Collaboration features
- Easy integration
Cons
- Requires setup
- Some features paid
- Focused on ML workflows
Platforms / Deployment
Cloud / Web / Cross-platform
Deployment: Cloud-based platform
Security & Compliance
Not publicly stated
Integrations & Ecosystem
Integrates with ML frameworks and workflows.
- PyTorch
- TensorFlow
- ML pipelines
- Cloud platforms
- Data tools
- Experiment tracking systems
Support & Community
Strong ML community and documentation
9. Prometheus with GPU Exporter
Short description:
Prometheus with GPU exporter enables monitoring of GPU metrics in observability stacks. It collects telemetry data and integrates with dashboards for visualization. It is widely used in cloud-native environments. It is ideal for DevOps and infrastructure teams.
Key Features
- Metrics collection
- GPU telemetry
- Alerting
- Integration with dashboards
- Scalable monitoring
- Time-series database
- Custom queries
Pros
- Highly scalable
- Open-source flexibility
- Strong ecosystem
Cons
- Requires setup
- Needs configuration
- Not beginner-friendly
Platforms / Deployment
Linux / Cloud
Deployment: Self-hosted monitoring stack
Security & Compliance
Not publicly stated
Integrations & Ecosystem
Works with observability tools and monitoring stacks.
- Kubernetes
- Grafana
- Exporters
- Cloud platforms
- Metrics pipelines
- DevOps tools
Support & Community
Large open-source community
10. Grafana GPU Monitoring
Short description:
Grafana provides visualization and monitoring dashboards for GPU metrics when integrated with data sources. It helps teams track performance trends and analyze GPU workloads. It is widely used in observability stacks. It is ideal for visualization and monitoring.
Key Features
- Dashboard visualization
- GPU metrics display
- Alerting
- Data source integration
- Custom panels
- Performance tracking
- Real-time monitoring
Pros
- Strong visualization
- Flexible dashboards
- Works with multiple data sources
Cons
- Requires backend setup
- Not a standalone profiler
- Needs integration
Platforms / Deployment
Cloud / Self-hosted
Deployment: Dashboard platform
Security & Compliance
Not publicly stated
Integrations & Ecosystem
Grafana integrates with monitoring and observability tools.
- Prometheus
- Cloud monitoring
- Metrics pipelines
- Kubernetes
- Data sources
- DevOps tools
Support & Community
Very strong community and documentation
Comparison Table
| Tool Name | Best For | Platform Supported | Deployment | Standout Feature | Public Rating |
|---|---|---|---|---|---|
| NVIDIA Nsight Systems | System profiling | Windows, Linux | Desktop | Timeline analysis | N/A |
| NVIDIA Nsight Compute | Kernel profiling | Windows, Linux | Desktop | Kernel metrics | N/A |
| NVIDIA DCGM | Data center monitoring | Linux | Cluster | GPU telemetry | N/A |
| AMD ROCm Profiler | AMD GPUs | Linux | ROCm | AMD support | N/A |
| Intel VTune Profiler | Hybrid profiling | Windows, Linux | Desktop | CPU GPU analysis | N/A |
| PyTorch Profiler | ML workflows | Cross-platform | Library | Model profiling | N/A |
| TensorFlow Profiler | ML workflows | Cross-platform | Library | Training insights | N/A |
| Weights and Biases | ML observability | Cloud | SaaS | Experiment tracking | N/A |
| Prometheus GPU Exporter | Monitoring | Linux, Cloud | Self-hosted | Metrics collection | N/A |
| Grafana GPU Monitoring | Visualization | Cloud, Self-hosted | Dashboard | Visualization | N/A |
Evaluation & Scoring of GPU Observability & Profiling Tools
| Tool Name | Core | Ease | Integrations | Security | Performance | Support | Value | Weighted Total |
|---|---|---|---|---|---|---|---|---|
| Nsight Systems | 9 | 7 | 8 | 7 | 9 | 8 | 8 | 8.3 |
| Nsight Compute | 9 | 6 | 8 | 7 | 9 | 8 | 8 | 8.2 |
| NVIDIA DCGM | 8 | 7 | 9 | 8 | 9 | 8 | 8 | 8.3 |
| AMD ROCm Profiler | 8 | 6 | 7 | 7 | 8 | 7 | 8 | 7.6 |
| Intel VTune | 8 | 7 | 8 | 7 | 8 | 8 | 8 | 7.9 |
| PyTorch Profiler | 7 | 9 | 8 | 7 | 8 | 8 | 9 | 8.2 |
| TensorFlow Profiler | 7 | 9 | 8 | 7 | 8 | 8 | 9 | 8.2 |
| Weights and Biases | 8 | 9 | 9 | 7 | 8 | 9 | 7 | 8.4 |
| Prometheus GPU | 8 | 6 | 9 | 8 | 8 | 8 | 9 | 8.1 |
| Grafana | 7 | 8 | 9 | 7 | 8 | 9 | 9 | 8.2 |
Scores are relative comparisons based on functionality, usability, and ecosystem strength. A higher score indicates a better overall balance. The best choice depends on whether you need deep profiling, monitoring, or ML observability.
Which GPU Observability Tool Is Right for You
Solo / Freelancer
Use PyTorch Profiler or TensorFlow Profiler for simple ML workloads. These tools are easy to integrate and provide quick insights.
SMB
Adopt Weights and Biases or Grafana with Prometheus for better visualization and collaboration.
Mid-Market
Use NVIDIA tools combined with Prometheus and Grafana for scalable monitoring and performance analysis.
Enterprise
Deploy NVIDIA DCGM with observability stacks for full cluster visibility and control.
Budget vs Premium
Open-source tools provide strong capabilities, while cloud tools offer ease of use and collaboration.
Feature Depth vs Ease of Use
Nsight tools provide deep analysis, while ML profilers are easier to use.
Integrations & Scalability
Prometheus and Grafana scale well for large environments.
Security & Compliance Needs
Evaluate data handling and deployment models carefully in enterprise environments.
Frequently Asked Questions
1. What is GPU observability
GPU observability is the process of monitoring GPU performance, usage, and behavior across workloads. It helps identify inefficiencies, bottlenecks, and performance issues. These insights are critical for optimizing workloads and improving system efficiency.
2. What is GPU profiling
GPU profiling focuses on analyzing how GPU resources are used during execution. It provides detailed metrics such as memory usage, kernel performance, and execution time. Profiling helps developers optimize code and improve performance.
3. Why are these tools important
These tools help reduce costs, improve performance, and optimize GPU usage. Without them, teams may waste resources or miss performance issues. They are essential for AI and HPC workloads.
4. Do I need both monitoring and profiling tools
Yes, monitoring provides high-level insights while profiling offers deep analysis. Using both together gives a complete view of GPU performance. This combination helps in debugging and optimization.
5. Are these tools only for AI workloads
No, they are also used in gaming, simulations, and scientific computing. However, AI and ML are the most common use cases. Any GPU-intensive workload can benefit from these tools.
6. Are these tools difficult to use
Some tools require technical expertise, especially system-level profilers. Others like ML profilers are easier to use. The complexity depends on the tool and use case.
7. Can these tools work in cloud environments
Yes, many tools support cloud deployments and GPU clusters. They integrate with cloud monitoring and observability platforms. This makes them suitable for modern infrastructure.
8. Do they support multiple GPUs
Yes, most tools support multi-GPU environments and distributed systems. This is important for large-scale workloads. Support varies depending on the tool.
9. Are open-source tools enough
Open-source tools can be very powerful and flexible. However, enterprise tools may offer better support and features. The choice depends on your needs.
10. How do I choose the right tool
Start by identifying your workload and goals. Then choose tools that match your infrastructure and skill level. Testing a few tools is the best approach.
Conclusion
GPU observability and profiling tools play a critical role in modern computing environments, especially where AI, machine learning, and high-performance workloads are involved. These tools help teams understand how GPUs are being used, identify inefficiencies, and optimize performance across systems. From deep profiling tools like Nsight to monitoring stacks like Prometheus and Grafana, the ecosystem offers solutions for every level of complexity. The right tool depends on your use case. Developers may prefer profiling tools for optimization, while operations teams may focus on monitoring and observability. ML teams benefit from integrated tools like PyTorch Profiler and TensorFlow Profiler. Cloud-native environments often rely on scalable monitoring solutions. There is no single best solution for all scenarios. It is important to evaluate tools based on your infrastructure, technical expertise, and performance goals. Start by shortlisting a few tools, test them with your workloads, and measure the results.
This comparison makes it easier to choose the right GPU monitoring and profiling solution for infrastructure requirements.
Very informative comparison showing how GPU profiling tools help optimize AI, ML, and high performance computing workloads efficiently.
This article explains GPU observability and profiling tools in simple language and helps readers understand GPU performance monitoring easily.