Introduction
Application Performance Monitoring (APM) tools help teams monitor, analyze, and optimize the performance of applications in real time. They provide deep visibility into application behavior by collecting and analyzing metrics such as response time, throughput, error rates, and transaction traces.
In modern environments powered by microservices, cloud-native architectures, APIs, and distributed systems, APM tools are essential. They enable teams to quickly detect bottlenecks, troubleshoot issues, and ensure a smooth user experience. With increasing system complexity, APM has evolved from basic monitoring to full-stack observability with AI-driven insights and automation.
Real-World Use Cases
- Monitoring application response times and uptime
- Identifying performance bottlenecks
- Troubleshooting production issues
- Tracking user experience and behavior
- Optimizing system performance and scalability
What Buyers Should Evaluate
- Distributed tracing capabilities
- Real-time monitoring and alerting
- Integration with cloud and DevOps tools
- Ease of deployment and instrumentation
- Scalability across environments
- AI-driven anomaly detection
- Visualization and dashboards
- Cost and data ingestion pricing
Best for: DevOps teams, SREs, developers, and enterprises managing high-traffic or distributed applications.
Not ideal for: Small applications with minimal performance monitoring needs.
Key Trends in Application Performance Monitoring (APM)
- AI-driven root cause analysis and anomaly detection
- Integration with full observability platforms
- OpenTelemetry adoption for instrumentation
- Monitoring of microservices and Kubernetes environments
- Real user monitoring (RUM) integration
- Shift toward cloud-native APM solutions
- Automation of performance optimization
- Support for serverless and edge computing
- Increased focus on developer experience
- Integration with DevSecOps workflows
How We Selected These Tools (Methodology)
- High adoption across DevOps and enterprise environments
- Strong APM and tracing capabilities
- Integration with modern cloud ecosystems
- Proven performance and scalability
- Security and compliance considerations
- Active development and vendor support
- Balanced mix of enterprise and open-source tools
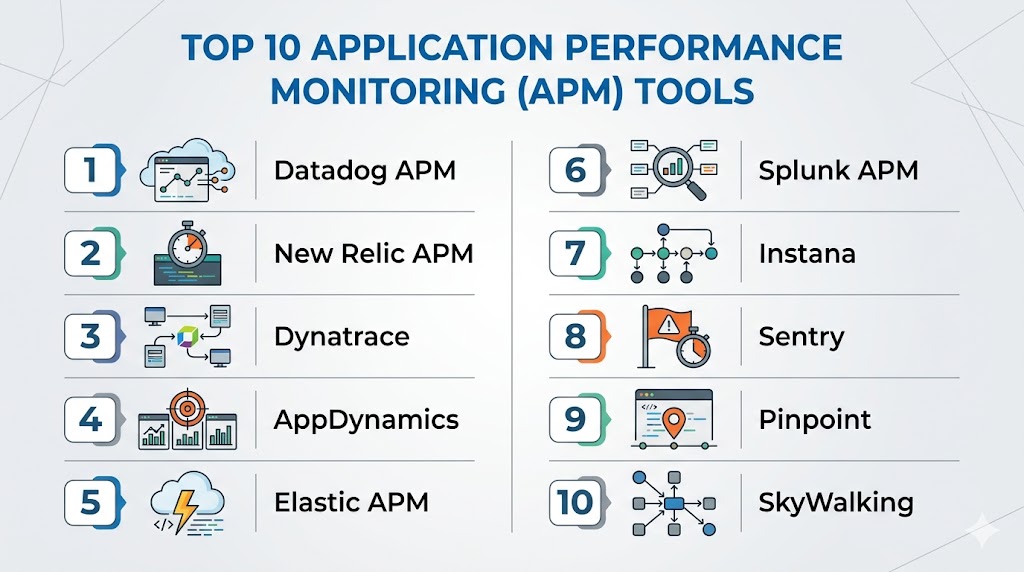
Top 10 Application Performance Monitoring (APM) Tools
#1 — Datadog APM
Short description: A cloud-native APM solution providing full-stack monitoring and real-time insights.
Key Features
- Distributed tracing
- Real-time monitoring
- AI-driven alerts
- Infrastructure integration
- Custom dashboards
Pros
- Unified observability
- Strong integrations
Cons
- Expensive at scale
- Pricing complexity
Platforms / Deployment
Web
Cloud
Security & Compliance
RBAC, audit logs
Not publicly stated
Integrations & Ecosystem
- AWS
- Azure
- Kubernetes
- CI/CD tools
Support & Community
Strong enterprise support.
#2 — New Relic APM
Short description: A developer-friendly platform offering detailed performance insights and telemetry.
Key Features
- Distributed tracing
- Metrics and logs
- Real-time alerts
- Custom dashboards
- OpenTelemetry support
Pros
- Flexible pricing
- Strong developer tools
Cons
- Complex UI
- Data costs
Platforms / Deployment
Web
Cloud
Security & Compliance
Encryption, RBAC
Not publicly stated
Integrations & Ecosystem
- Cloud platforms
- DevOps tools
Support & Community
Strong documentation.
#3 — Dynatrace
Short description: An enterprise-grade APM tool with AI-driven automation and deep system visibility.
Key Features
- Full-stack monitoring
- AI root cause analysis
- Real user monitoring
- Automatic discovery
- Cloud-native support
Pros
- Strong automation
- Deep insights
Cons
- Expensive
- Learning curve
Platforms / Deployment
Web
Cloud / Hybrid
Security & Compliance
RBAC, audit logs
Not publicly stated
Integrations & Ecosystem
- Cloud providers
- Kubernetes
Support & Community
Enterprise support.
#4 — AppDynamics
Short description: A performance monitoring platform focused on business transaction visibility.
Key Features
- Transaction monitoring
- Performance analytics
- Real-time alerts
- Business insights
- Distributed tracing
Pros
- Strong business insights
- Enterprise-ready
Cons
- Complex setup
- High cost
Platforms / Deployment
Web
Cloud / Self-hosted
Security & Compliance
RBAC
Not publicly stated
Integrations & Ecosystem
- Enterprise systems
- DevOps tools
Support & Community
Enterprise support.
#5 — Elastic APM
Short description: A component of the Elastic Stack for monitoring application performance and logs.
Key Features
- Distributed tracing
- Metrics and logs
- Open-source
- Integration with Elastic Stack
- Dashboards
Pros
- Flexible deployment
- Strong search capabilities
Cons
- Setup complexity
- Resource-intensive
Platforms / Deployment
Windows / macOS / Linux
Cloud / Self-hosted
Security & Compliance
Encryption, RBAC
Not publicly stated
Integrations & Ecosystem
- Elasticsearch
- Kibana
Support & Community
Strong open-source community.
#6 — Splunk APM
Short description: A platform combining APM with advanced analytics and observability.
Key Features
- Distributed tracing
- Real-time monitoring
- AI-driven insights
- Metrics and logs
- Dashboards
Pros
- Powerful analytics
- Enterprise-ready
Cons
- Expensive
- Complex setup
Platforms / Deployment
Web
Cloud
Security & Compliance
RBAC, encryption
Not publicly stated
Integrations & Ecosystem
- DevOps tools
- Cloud platforms
Support & Community
Enterprise support.
#7 — Instana
Short description: An APM tool focused on automation and real-time observability.
Key Features
- Automatic instrumentation
- Distributed tracing
- Real-time monitoring
- AI insights
- Kubernetes support
Pros
- Easy setup
- Strong automation
Cons
- Paid solution
- Limited customization
Platforms / Deployment
Web
Cloud
Security & Compliance
RBAC
Not publicly stated
Integrations & Ecosystem
- Kubernetes
- Cloud platforms
Support & Community
Enterprise support.
#8 — Sentry
Short description: A developer-focused tool for error tracking and performance monitoring.
Key Features
- Error tracking
- Performance monitoring
- Distributed tracing
- Alerts
- Integration with dev tools
Pros
- Developer-friendly
- Easy integration
Cons
- Limited full-stack capabilities
- Paid features
Platforms / Deployment
Web
Cloud / Self-hosted
Security & Compliance
Not publicly stated
Integrations & Ecosystem
- Git platforms
- Dev tools
Support & Community
Strong developer community.
#9 — Pinpoint
Short description: An open-source APM tool designed for large-scale distributed systems.
Key Features
- Distributed tracing
- Transaction monitoring
- Real-time visualization
- Multi-language support
- Open-source
Pros
- Free to use
- Scalable
Cons
- Complex setup
- Limited UI polish
Platforms / Deployment
Linux
Self-hosted
Security & Compliance
Not publicly stated
Integrations & Ecosystem
- DevOps tools
- Cloud platforms
Support & Community
Active open-source community.
#10 — SkyWalking
Short description: An open-source observability platform with strong APM capabilities.
Key Features
- Distributed tracing
- Metrics and logs
- Service topology
- Cloud-native support
- Open-source
Pros
- Strong cloud-native support
- Free and flexible
Cons
- Setup complexity
- Requires expertise
Platforms / Deployment
Windows / Linux
Cloud / Self-hosted
Security & Compliance
Not publicly stated
Integrations & Ecosystem
- Kubernetes
- Cloud-native tools
Support & Community
Growing community.
Comparison Table (Top 10)
| Tool Name | Best For | Platform(s) Supported | Deployment | Standout Feature | Public Rating |
|---|---|---|---|---|---|
| Datadog | Cloud teams | Web | Cloud | Full-stack | N/A |
| New Relic | Dev teams | Web | Cloud | Flexibility | N/A |
| Dynatrace | Enterprise | Web | Hybrid | AI insights | N/A |
| AppDynamics | Enterprises | Web | Hybrid | Business metrics | N/A |
| Elastic APM | Open-source | Multi-OS | Hybrid | Search | N/A |
| Splunk | Analytics | Web | Cloud | Data insights | N/A |
| Instana | Automation | Web | Cloud | Auto instrumentation | N/A |
| Sentry | Developers | Web | Hybrid | Error tracking | N/A |
| Pinpoint | Open-source | Linux | Self-hosted | Tracing | N/A |
| SkyWalking | Cloud-native | Multi-OS | Hybrid | Topology | N/A |
Evaluation & Scoring of Application Performance Monitoring (APM) Tools
| Tool Name | Core | Ease | Integrations | Security | Performance | Support | Value | Weighted Total |
|---|---|---|---|---|---|---|---|---|
| Datadog | 10 | 8 | 10 | 9 | 9 | 9 | 7 | 9.0 |
| New Relic | 9 | 8 | 9 | 9 | 8 | 9 | 8 | 8.7 |
| Dynatrace | 10 | 7 | 9 | 10 | 9 | 9 | 7 | 9.0 |
| AppDynamics | 9 | 7 | 8 | 9 | 9 | 9 | 6 | 8.5 |
| Elastic | 8 | 7 | 9 | 8 | 8 | 8 | 9 | 8.3 |
| Splunk | 10 | 7 | 9 | 9 | 9 | 9 | 6 | 8.8 |
| Instana | 9 | 8 | 8 | 8 | 9 | 8 | 7 | 8.4 |
| Sentry | 8 | 9 | 8 | 7 | 8 | 8 | 9 | 8.2 |
| Pinpoint | 8 | 6 | 7 | 7 | 9 | 7 | 10 | 7.9 |
| SkyWalking | 8 | 6 | 8 | 7 | 9 | 7 | 10 | 8.0 |
How to interpret scores:
These scores compare tools across key criteria like features, usability, and value. Higher scores indicate strong overall capabilities, but the best choice depends on your infrastructure. Enterprise tools excel in automation and insights, while open-source tools offer flexibility and cost efficiency.
Which Application Performance Monitoring (APM) Tool Is Right for You?
Solo / Freelancer
Sentry and Pinpoint are lightweight and cost-effective.
SMB
New Relic and Datadog provide ease of use and scalability.
Mid-Market
Elastic APM and Instana offer flexibility and automation.
Enterprise
Dynatrace and AppDynamics provide deep insights and control.
Budget vs Premium
- Budget: Pinpoint, SkyWalking
- Premium: Dynatrace, Datadog
Feature Depth vs Ease of Use
- Feature-rich: Dynatrace
- Easy-to-use: New Relic
Integrations & Scalability
- Best integrations: Datadog
- Scalable: Splunk
Security & Compliance Needs
- Strong security: Dynatrace
- Moderate: Sentry
Frequently Asked Questions (FAQs)
What is APM?
It monitors and optimizes application performance.
Why is APM important?
It helps detect issues and improve user experience.
Do APM tools support cloud environments?
Yes, most modern tools support cloud and Kubernetes.
Are APM tools expensive?
Enterprise tools can be costly; open-source options are cheaper.
Do they integrate with CI/CD?
Yes, integration is a core feature.
Can small teams use APM tools?
Yes, many tools offer lightweight options.
What data do APM tools collect?
Metrics, traces, logs, and errors.
Are APM tools secure?
Most include security features like encryption and RBAC.
What is the best APM tool?
Depends on your infrastructure and needs.
Do they support AI insights?
Many modern tools include AI-driven analysis.
Conclusion
Application Performance Monitoring (APM) tools are essential for ensuring reliable, high-performing applications in modern distributed environments. By providing deep insights into system behavior, these tools help teams quickly identify issues, optimize performance, and deliver better user experiences. Whether you choose enterprise-grade platforms like Dynatrace and Datadog or open-source solutions like SkyWalking and Pinpoint, the right tool depends on your scale, budget, and technical requirements. As systems become more complex, investing in APM is critical for maintaining performance and reliability. Start by shortlisting a few tools, testing them in your environment, and validating their ability to deliver actionable insights before making a final decision.