Introduction
Markets never move in a straight line. Prices zigzag up and down every single day, creating waves of optimism and fear. For a beginner looking at a stock or crypto chart, this constant motion can look like total chaos.
Yet, beneath those random-looking wiggles, markets often follow hidden paths. Prices tend to move in sustained directions for weeks or months at a time. Spotting these paths is one of the most valuable skills a trader can learn.
Many beginners struggle because they rely on complicated indicators that lag behind the actual market price. Others lose money because they chase fast-moving prices without a plan.
This guide will teach you how to trade using trendlines. You will learn what they are, how to draw them accurately, how to spot real trading opportunities, and how to protect your capital from false breakouts.
What Are Trendlines?
A trendline is a visual tool used in technical analysis. Technical analysis is the practice of studying past price movements to predict future price behavior.
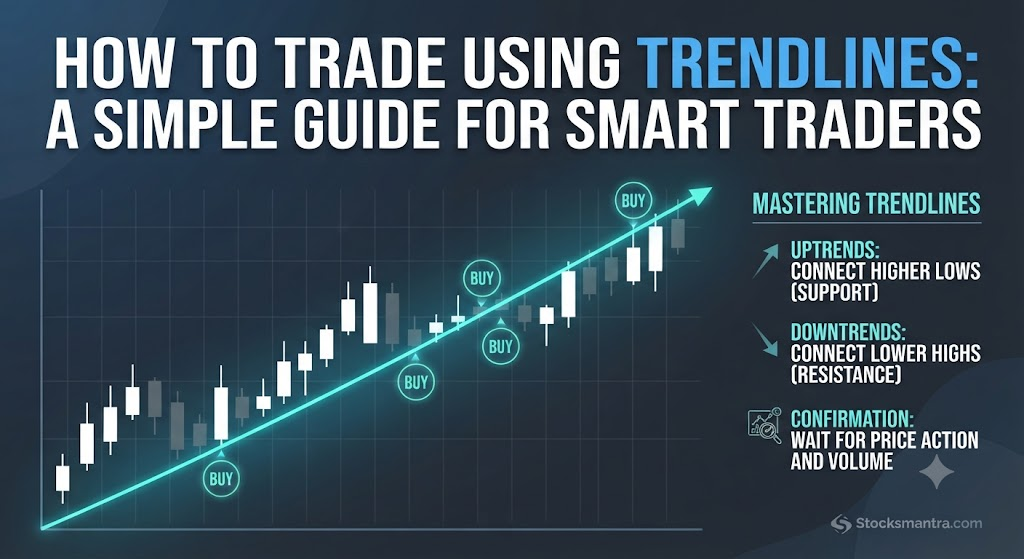
Imagine looking at a chart of a company’s stock over the past three months. If the stock is climbing, every dip in price stops at a higher level than the previous dip, and every peak goes higher than the last. By drawing a straight line connecting those rising lows, you get an upward trendline.
Why Do Trendlines Matter?
Trendlines matter because they show the collective psychology of the market. They represent the balance between buyers and sellers:
- In an Uptrend: Buyers are more aggressive than sellers. Every time the price dips slightly, buyers step in and push it back up.
- In a Downtrend: Sellers are in control. Every time the price bounces slightly, sellers step in and push it back down.
By marking these boundaries, a trendline gives you a visual map of where market sentiment might shift. It helps you answer two critical questions: Which direction should I trade? and Where is a sensible place to risk my money?
How Trendlines Work
To understand how trendlines work, you need to understand the basic anatomy of a price chart. Markets move in swings:
- Peaks (Troughs/Highs): Points where the price stops going up and starts going down.
- Valleys (Lows): Points where the price stops going down and starts going up.
The Rule of Two and Three
To draw a valid trendline, you need at least two connecting points:
- For an uptrend line, you connect at least two rising lows.
- For a downtrend line, you connect at least two falling highs.
However, a line with only two points is just a guess. The real power comes with the third point. When the price touches your trendline a third time and bounces away, your line is confirmed. That third touch transforms a random line into a reliable trading zone.
Types of Trends and Trendlines
Different market conditions require different types of lines. Recognizing the current market structure keeps you from fighting the broader momentum.
1. Uptrend Lines (Bullish)
An uptrend line slopes upward from left to right. It is drawn underneath the price action by connecting successive higher lows.
- What it tells you: Demand is strong. Buyers are willing to pay higher prices as time goes on.
- Trading approach: Look for buying opportunities when the price pulls back to touch the trendline.
2. Downtrend Lines (Bearish)
A downtrend line slopes downward from left to right. It is drawn above the price action by connecting successive lower highs.
- What it tells you: Supply is heavy. Sellers are eager to unload their assets at lower and lower prices.
- Trading approach: Look for selling or short-selling opportunities when the price rallies up to touch the trendline.
3. Sideways Channels (Ranging Markets)
Sometimes, prices move sideways between a parallel ceiling and floor. While not a directional trend, horizontal trendlines can be drawn to mark support (the floor) and resistance (the ceiling). Traders buy near the floor and sell near the ceiling until a breakout occurs.
Step-by-Step Guide to Drawing Accurate Trendlines
Drawing trendlines is part science and part art. If you draw them incorrectly, your trading signals will fail. Follow this repeatable process to get it right.
- Step 1: Zoom Out: Switch to a higher timeframe, such as a daily or 4-hour chart, to see the big picture. Avoid drawing lines on tiny 1-minute timeframes where noise dominates.
- Step 2: Identify Major Swings: Look for obvious turning points where the price made a sharp reversal. Ignore small, insignificant wiggles.
- Step 3: Connect the Extremes:
- For an uptrend, connect the lowest points of the dips. Make sure the line does not cut through any price bars in between. Prices can touch the line or come close to it, but they should not slice straight through the middle of active candles.
- Step 4: Extend the Line: Extend your line forward into empty chart space. This creates a projected zone where the price might react in the future.
- Step 5: Adjust as Needed: Markets evolve. If a price breaks past your line slightly and creates a new swing point, redraw your line to accommodate the new market reality.
Practical Examples in the Real World
Let us look at how this works through practical scenarios.
Example 1: The Pullback Trader in an Uptrend
Imagine a popular technology stock is in a strong uptrend. Over two months, it climbs from 100 dollars to 150 dollars, pulling back along a clean upward trendline three times.
- A disciplined trader draws the trendline connecting the lows at 105 and 120 dollars.
- When the stock pulls back to touch the trendline again at 135 dollars, the trader does not buy blindly. They wait for a bullish price action confirmation, such as a green candlestick bouncing off the line.
- The trader buys at 137 dollars, placing a protective stop-loss order just below the trendline at 132 dollars. If the trend holds, the stock continues upward to 150 dollars or higher, giving the trader a favorable risk-to-reward ratio.
Example 2: The Breakdown in a Downtrend
Imagine a commodity is locked in a steady downtrend, bouncing down from a falling resistance line.
- Sellers use this overhead line to enter short positions whenever the price rallies to meet it.
- Eventually, buying pressure builds up, and a large green candle closes firmly above the downtrend line. This signals a potential trend reversal, warning sellers to exit and inviting breakout buyers into the market.
Common Mistakes Traders Make
Even experienced traders make errors with trendlines. Knowing these pitfalls will save you from unnecessary losses.
| What People Do | Why They Do It | Why It Causes Problems | What They Should Do Instead |
| Forcing the line | They want a trade setup so badly that they draw lines through candles. | A trendline is not valid if price bars cut right through it. It distorts support and resistance. | Only connect major swing points where prices cleanly bounce off the line. |
| Trading every touch | They feel eager to be active in the market all day long. | Not every touch is a valid setup. Overtrading leads to high transaction costs and constant losses. | Wait for confirmation signals, such as strong candlestick patterns at the trendline. |
| Ignoring the bigger trend | They look only at 5-minute charts and miss the macro direction. | Short-term trendlines often fail if they go against the main daily or weekly trend. | Always check higher timeframes first before trading local trendline bounces. |
| Placing stops too tight | They want to minimize potential dollar loss on a single trade. | Normal market noise can trigger tight stop-losses right before the trend resumes. | Place stop-losses safely below the swing low or beyond the trendline boundary. |
Risks and Limitations
Trendlines are powerful, but they are not magic crystals. Understanding their limitations prevents false confidence.
- Subjectivity: Two traders can look at the exact same chart and draw two slightly different trendlines. One trader’s support line is another trader’s missed opportunity.
- False Breakouts (Whipsaws): Prices will frequently poke through a trendline only to snap back inside the original direction. This traps breakout traders into bad positions.
- Market Conditions: Trendlines work best in trending markets. During choppy, sideways, or erratic markets, trendlines lose their effectiveness entirely.
Decision-Making Framework for Trendline Trading
Before you risk your capital based on a trendline bounce, run through this quick evaluation checklist:
- Identify the Macro Trend: Is the overall daily chart moving up, down, or sideways? Never trade against the macro trend unless you are an advanced swing trader.
- Verify the Anchor Points: Does your line connect at least two clean, undeniable swing points with a third confirmation touch?
- Check Market Context: Is major economic news scheduled that could cause sudden volatility and shatter technical levels?
- Define Your Risk: Where will you place your stop-loss order if the trendline breaks? Is the potential reward at least double your risk?
- Wait for Confirmation: Does the price show hesitation or reversal signs at the line before you enter?
Key Terms
- Support: A price level where a downtrend is expected to pause due to a concentration of buying interest.
- Resistance: A price level where an uptrend is expected to pause due to a concentration of selling interest.
- Swing High: A peak price point higher than the candles immediately surrounding it on both sides.
- Swing Low: A trough price point lower than the candles immediately surrounding it on both sides.
- Breakout: When the price moves decisively outside a defined support or trendline boundary.
- Pullback: A temporary minor price movement in the opposite direction of the prevailing trend.
- Stop-Loss: An automatic order placed with a broker to close a losing trade at a predetermined price level.
- Timeframe: The span of time represented by each individual candle or bar on a chart (e.g., 1-hour, daily, weekly).
Frequently Asked Questions
How many points do I need to draw a valid trendline?
You need a minimum of two points to draw a line, but a trendline is only considered reliable and actionable once the price respects it for a third time.
Why did the price break my trendline and then reverse?
This is known as a false breakout or stop hunt. Smart money players often push prices past obvious technical levels to trigger retail stop-losses before moving the asset in the true direction. Always wait for a candle close beyond the line to confirm a genuine break.
Should I connect the wicks or the bodies of the candles?
Most professional traders prefer connecting the extreme wicks because wicks represent the absolute high or low prices reached during that period. However, some prefer candle bodies if wicks create erratic spikes. Consistency is more important than which method you choose.
Do trendlines work on all timeframes?
Yes, you can draw trendlines on any timeframe from 1-minute charts to monthly charts. However, lines drawn on higher timeframes (daily and weekly) are much more reliable and respected by large institutional market participants than lines on minute charts.
Can I use trendlines without other indicators?
Many price action traders use clean charts with only trendlines and volume. While indicators like moving averages or RSI can help, mastering pure price action and trendlines gives you a clear, uncluttered view of market supply and demand.
Conclusion
Trendlines are one of the most straightforward yet effective tools in technical analysis. They transform chaotic price charts into clear maps of market direction, showing you where buyers and sellers are taking control.
Remember that trendlines are tools for managing probability, not certainty. By drawing your lines carefully using confirmed swing points, respecting the broader market trend, and always using sensible stop-losses, you can dramatically improve your trading decisions. Keep your charts clean, practice patience, and let the market come to your trendlines rather than chasing every move.