Introduction
Imagine watching a powerful runner sprint forward, suddenly get tired, and take a few steps backward to catch their breath before sprinting again. Price charts in the stock market behave in a very similar way.
When a stock experiences a massive rally, it gets overextended. Buyers take profits, sellers step in temporarily, and the price dips. For a beginner looking at a chaotic chart filled with red and green candles, predicting where that dip will end feels like guessing the weather next month.
Many traders turn to Fibonacci retracement to bring order to this confusion. But the name itself sounds intimidating. It sounds like an advanced engineering formula meant only for rocket scientists.
In reality, the concept is built on a famous mathematical sequence discovered centuries ago, and applying it to charts is surprisingly straightforward once you know what to look for. This article breaks down Fibonacci retracement, showing you how it works, why traders rely on it, and what dangerous mistakes you must avoid when using it.
What Is Fibonacci Retracement?
At its core, a Fibonacci retracement is a technical analysis tool used to identify potential support and resistance levels on a price chart.
To understand the tool, we first need to look at the numbers behind it. The system is based on the Fibonacci sequence, a famous mathematical pattern where each number is the sum of the two preceding ones (0, 1, 1, 2, 3, 5, 8, 13, 21, and so on).
While the sequence itself is fascinating, traders care more about the ratios derived from these numbers. When you divide numbers in this sequence by other numbers in the sequence, you get key ratios. The most important ones used in trading are:
- 61.8% (often called the golden ratio)
- 38.2%
- 50% (borrowed from math theory, though not technically a Fibonacci number)
- 23.6%
- 78.6%
In the stock market, these percentages represent how much a previous price move might “take back” before resuming its original trend.
Why It Matters
Markets move in waves. Recognizing these waves helps you avoid buying at the absolute peak or panicking during a normal, healthy pullback. Fibonacci levels act like invisible safety nets where a falling price might pause and reverse.
How Fibonacci Retracement Works
Using the tool on a trading platform requires identifying two main points on a chart: the Swing Low and the Swing High.
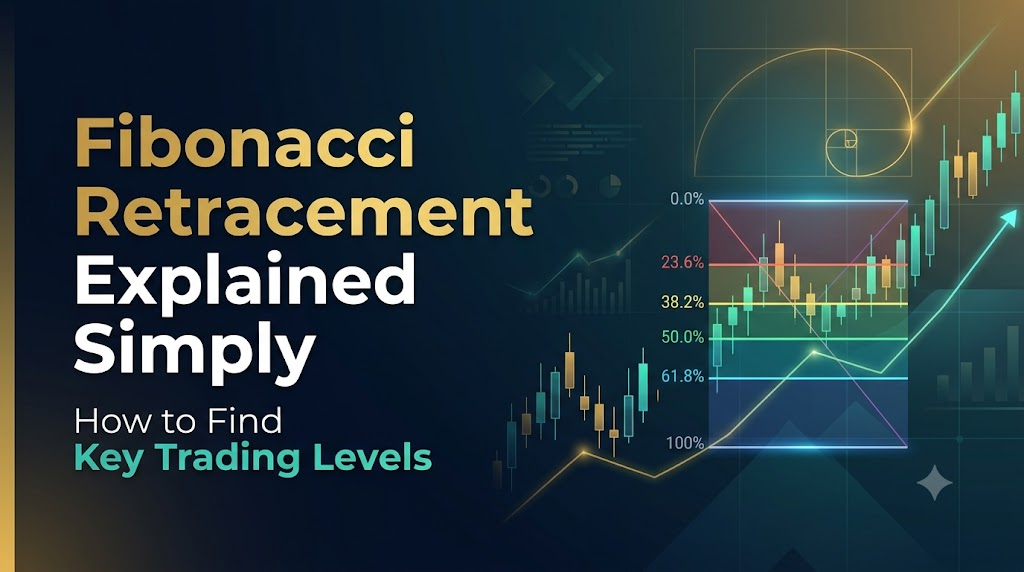
- In an Uptrend: You draw the Fibonacci tool from the lowest point of a recent price surge (Swing Low) up to the highest point of that surge (Swing High). The tool automatically divides that total distance into percentage lines (23.6%, 38.2%, 50%, 61.8%, etc.) sitting below the peak.
- In a Downtrend: You draw the tool from the Swing High down to the Swing Low. The lines now sit above the lowest point, acting as potential resistance where a falling price might hit a ceiling and drop further.
As the price pulls back downward from its peak, traders watch how it reacts when it touches the 38.2% or 61.8% lines. If the price stalls and starts moving upward again, the retracement level has successfully acted as support.
Why Does It Work? (Self-Fulfilling Prophecy)
A common question beginners ask is: Why would magical numbers from math influence human buying and selling behavior?
The truth is, Fibonacci levels do not possess mystical powers. They work largely because millions of traders and automated computer algorithms look at the exact same lines.
When a large group of market participants places buy orders or sets stop-losses around the 61.8% retracement level, their collective actions create a real psychological floor or ceiling. It becomes a self-fulfilling prophecy. Because everyone expects something to happen at that price, they act accordingly, making the event actually happen.
Practical Example
Let us look at a hypothetical stock called TechCorp.
- TechCorp’s stock price shoots up from $100 to $200. This is your Swing Low ($100) and Swing High ($200). The total price increase is $100.
- After hitting $200, the broader market cools down, and TechCorp’s price begins to drop.
- You apply the Fibonacci retracement tool to the chart.
- The tool shows a 50% retracement level at $150 and a 61.8% retracement level at $138.20.
- As the price slides down to $150, sellers run out of steam, and buyers step in, viewing $150 as a fair discount for a strong company. The price bounces upward.
In this scenario, the 50% Fibonacci level gave you a clear area to watch for a potential buying opportunity, rather than guessing blindly in the dark.
Real-World Considerations
Relying solely on lines drawn on a screen is a recipe for losing money. Real-world trading involves messy charts, false breakouts, and sudden news events that ignore math entirely.
Market Context
Fibonacci levels work best in a strong, clear trend. If a stock is moving sideways in a choppy range, the retracement lines lose much of their reliability because there is no dominant direction.
Confirmation is Key
Never buy or sell a stock just because the price touched a Fibonacci line. Always look for confirmation signals, such as:
- A bullish candlestick pattern (like a hammer or engulfing candle).
- An increase in trading volume near the level.
- Support from other technical indicators like moving averages or the Relative Strength Index (RSI).
Common Mistakes Beginners Should Make
1. Drawing the Tool Upside Down or on the Wrong Points
- Why they do it: Rushing through chart setup or misunderstanding which candle represents the true swing extreme.
- Why it causes problems: The retracement lines will be inverted, pointing you toward incorrect price targets.
- What they should do instead: Double-check that your tool is anchored from the absolute lowest wick to the absolute highest wick of the impulsive move.
2. Treating Fibonacci Levels as Exact Price Pins
- Why they do it: Expecting the stock price to reverse the exact second it touches a decimal-perfect percentage line.
- Why it causes problems: Markets are organic and messy; prices often overshoot a line slightly before reversing.
- What they should do instead: View Fibonacci levels as zones or regions rather than razor-thin lines.
3. Ignoring the Broader Trend
- Why they do it: Trying to catch a falling knife on a stock that is in a long-term structural decline.
- Why it causes problems: The retracement level will break easily because the overarching market pressure is pointing down.
- What they should do instead: Only trade pullbacks that align with the major daily or weekly trend.
Risks and Limitations
| Risk / Limitation | Why It Matters | How to Reduce It |
|---|---|---|
| Subjectivity | Different traders pick different swing highs and lows, leading to conflicting lines. | Stick to major, obvious swing points on higher timeframes (like daily charts). |
| False Breakouts | Price might pierce a 61.8% level and keep plunging, causing heavy losses. | Always use stop-loss orders below the next logical support level. |
| Over-reliance | Using Fibonacci in isolation without checking company fundamentals or market news. | Combine technical analysis with basic fundamental checks. |
Decision-Making Framework
Use this simple step-by-step framework before placing a trade based on Fibonacci levels:
- Identify the Trend: Is the stock in a clear, healthy upward trend? If not, step away.
- Find the Extremes: Locate the clear Swing Low and Swing High of the latest impulse wave.
- Apply the Tool: Draw your Fibonacci retracement and mark the 38.2%, 50%, and 61.8% zones.
- Wait for the Price: Let the price pull back naturally toward your marked zones. Do not chase it.
- Look for Triggers: Wait for a reversal candle or volume spike inside the zone.
- Manage Risk: Place a stop-loss just beneath the swing low or key support zone to protect your capital if the trade fails.
Key Terms
- Support: A price level where a falling stock tends to stop dropping because buying interest is strong.
- Resistance: A price level where a rising stock tends to pause because selling pressure is strong.
- Swing High: The highest peak price reached during a specific upward price movement before a pullback occurs.
- Swing Low: The lowest trough price reached before a strong upward price movement begins.
- Pullback (Retracement): A temporary, minor dip in the price of a stock that is otherwise moving in a larger upward trend.
- Impulse Wave: A sharp, powerful price movement in the direction of the main trend.
- Stop-Loss: An order placed with a broker to sell a security automatically when it reaches a certain price, limiting potential losses.
- Golden Ratio: The 61.8% Fibonacci level, widely watched by traders as the most critical retracement boundary.
FAQs
Can I use Fibonacci retracement for day trading?
Yes. Day traders use Fibonacci retracements on short-term charts (like 5-minute or 15-minute intervals). However, the principles remain identical: they work best when applied to clear, fast-moving intraday price swings.
Which Fibonacci level is the most reliable?
The 61.8% level is widely considered the most important and reliable retracement level by many technical analysts, followed closely by the 50% midpoint mark.
Do Fibonacci retracements work on all stocks?
They work best on liquid stocks, major market indices, and cryptocurrencies with high trading volume. Illiquid stocks with low trading volume often exhibit erratic price movements that ignore technical indicators.
What happens if the price breaks past the 100% Fibonacci level?
If the price goes past the starting point of your measured move (the Swing Low in an uptrend), the original trend is officially broken or reversed. Your bullish setup is no longer valid.
Do I need paid software to use Fibonacci tools?
No. Almost all modern trading platforms and charting websites offer the Fibonacci retracement tool completely free of charge.
Can Fibonacci levels predict exact stock prices?
No. They offer probability zones, not guarantees. Markets are chaotic, and unexpected news can break any technical pattern at any time.
Conclusion
Fibonacci retracement bridges the gap between chaotic price charts and structured decision-making. By understanding that markets move in waves and pull back to predictable mathematical zones, you can stop guessing where to enter a trade and start planning your entries with clear boundaries.
Remember that these tools are not crystal balls or magical guarantees. They work because thousands of market participants watch the exact same levels, turning shared psychology into reliable support and resistance zones. Always combine Fibonacci analysis with proper risk management, wait for confirmation candles before acting, and keep your stop-losses firmly in place. Master this balance of math, psychology, and risk control, and you will navigate market pullbacks with confidence.