Introduction
When you first look at a stock or crypto chart, it can feel like looking at a secret code. Green and red rectangles stretch across the screen, moving up and down with no obvious pattern. It is easy to feel overwhelmed by the sheer volume of data moving every second.
This confusion often leads to emotional trading. Many beginners buy assets simply because they are going up, only to watch the price crash immediately after. They enter the market without knowing where prices might head next.
This is where candlestick patterns come in. Think of them as a visual language that tells the story of a battle between buyers and sellers during a specific timeframe. By learning to read these patterns, you can stop guessing and start understanding what market participants are actually doing.
In this article, you will learn what candlestick patterns are, how they work, the most reliable patterns to look for, and how to avoid common mistakes while using them.
What Is a Candlestick Pattern?
A candlestick pattern is a formation created on a price chart by individual or multiple price bars (called candlesticks) over a set period, such as one day or one hour.
Understanding the Anatomy of a Candlestick
Every standard candlestick tells you four vital pieces of information about price movement during that timeframe:
- Open: The price when the time period began.
- Close: The price when the time period ended.
- High: The highest price reached during that period.
- Low: The lowest price reached during that period.
A candlestick consists of a wide central part called the body and thin lines sticking out from the top and bottom called shadows or wicks.
- Bullish Candle (Usually Green or White): The close is higher than the open. This shows that buyers drove the price up during that timeframe.
- Bearish Candle (Usually Red or Black): The close is lower than the open. This shows that sellers pushed the price down.
Why It Matters
Candlesticks turn raw numbers into a clear picture of market psychology. Instead of scanning endless rows of pricing tables, a single glance tells you who is winning the tug-of-war between buyers and sellers.
How Candlestick Patterns Work
Candlesticks do not predict the future with 100% certainty. Instead, they show probabilities based on historical human behavior.
When a large number of market participants react the same way to a specific price setup, certain patterns repeat themselves. For example, if sellers push a price down all day, but buyers aggressively step in near the end of the session to drive the price right back up, it leaves a distinct visual mark on the chart. That mark signals a potential change in momentum.
Traders use these patterns to answer three core questions:
- Where is the current trend heading?
- Are the current participants losing their strength?
- Where should I place my risk limits?
Why Candlestick Patterns Matter in Modern Trading
In fast-moving financial markets, speed and clarity are everything. Relying solely on complex mathematical indicators can sometimes cause delays because indicators calculate past data after the move has already begun.
Candlestick patterns reflect current price action directly. They help you:
- Spot Reversals Early: Catch a turning point before the rest of the market notices.
- Manage Risk: Provide clear visual levels to place stop-loss orders (limits to cut your losses if a trade goes wrong).
- Filter Noise: Ignore minor price fluctuations and focus on high-probability setups.
The Best Candlestick Patterns for Trading
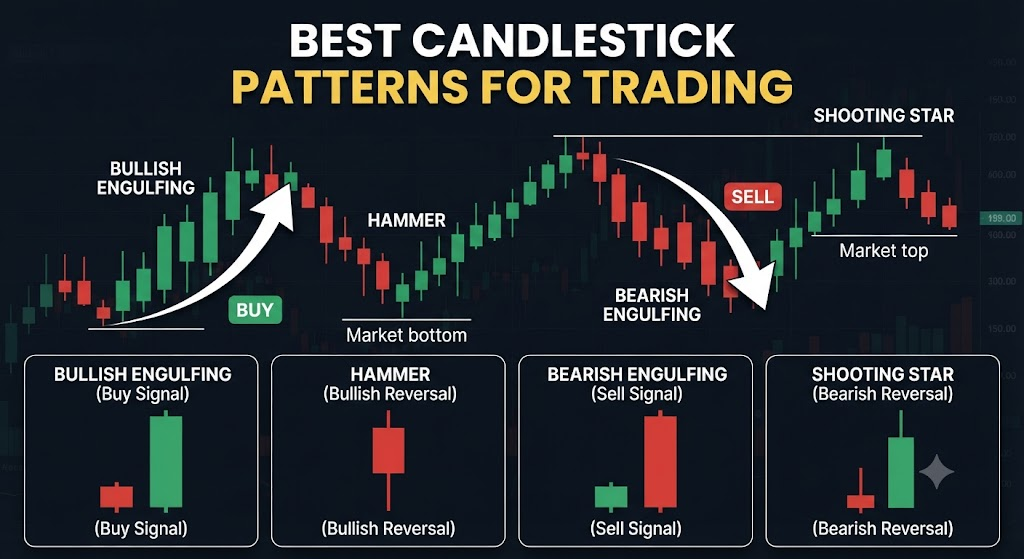
While there are dozens of patterns, focusing on a few reliable ones is much more effective than trying to memorize every single formation. Here are the best candlestick patterns every trader should know.
1. The Hammer (Bullish Reversal)
- What it is: A single-candle pattern that appears at the bottom of a downtrend. It has a small body near the top and a long lower wick that is at least twice the size of the body.
- Why it matters: It shows that sellers pushed the price down significantly during the session, but buyers overpowered them before the close and drove the price back up.
- Example: Imagine a stock falls from $50 to $40 over a week. On the final day, sellers drop the price to $35, but buyers rush in, pushing the price back up to $48 by the end of the day. This creates a classic Hammer shape, signaling that selling pressure might be exhausting.
2. The Shooting Star (Bearish Reversal)
- What it is: The opposite of the Hammer. It appears at the top of an uptrend, featuring a small body near the bottom and a long upper wick.
- Why it matters: Buyers tried to push the price higher during the session, but sellers took over and forced the price back down near the open. It warns that an uptrend may be losing steam.
3. Bullish Engulfing Pattern
- What it is: A two-candle pattern. The first candle is a small bearish (red) candle. The second candle is a large bullish (green) candle that completely “engulfs” or covers the body of the previous red candle.
- Why it matters: It shows a dramatic shift in momentum. Sellers were in control on day one, but buyers completely overwhelmed them on day two, wiping out the previous day’s losses.
4. Bearish Engulfing Pattern
- What it is: A two-candle pattern appearing at the top of an uptrend. A small green candle is followed by a large red candle that completely engulfs it.
- Why it matters: Sellers have stepped in with massive volume, overpowering the existing buyers and signaling a potential downward reversal.
Important Factors to Understand
Recognizing a pattern shape is only half the battle. Context dictates whether a pattern will work or fail.
- Location Matters: A Hammer pattern appearing in the middle of a sideways market holds very little value. The same Hammer appearing after a sharp drop in price is much more powerful.
- Timeframes: Patterns on higher timeframes (like daily or weekly charts) are generally more reliable than patterns on very short timeframes (like 1-minute charts), which often contain random market noise.
- Confirmation: Many professional traders wait for a “confirmation candle” (the candle immediately following the pattern) to close in the expected direction before entering a trade.
Practical Examples in the Markets
Let us look at how a trader applies these concepts in real life.
Imagine you are watching a major technology stock that has been steadily dropping in price over the past three weeks. Investors are panicking, and selling pressure is high.
Instead of jumping in blindly, you wait for signs of stabilization. On Tuesday, the stock prints a clear Hammer pattern near a major historical support level (a price zone where buyers have historically stepped in). The lower wick shows that sellers tried to crash the price further, but failed.
Rather than buying immediately, you wait for Wednesday’s candle to open higher and close green. This serves as your confirmation. You enter a buy trade with a stop-loss order placed just below the low wick of the Hammer. If the price breaks below that low, your thesis is proven wrong, and you exit the trade with a small, controlled loss. If the price rebounds as expected, you capture a profitable upward move.
Real-World Considerations
Trading candlestick patterns is not a foolproof science. Real-world markets involve human emotions, global news events, and sudden economic shifts that can invalidate even the cleanest chart setup.
- False Breakouts: A pattern might look perfect, but a sudden news headline can reverse the market instantly.
- Market Conditions: Patterns perform differently in strong trending markets compared to choppy, range-bound markets.
- Patience Required: Waiting for high-probability setups means sitting on your hands for long periods without placing trades.
Common Mistakes Traders Should Make
- Trading Every Pattern You See:
- Why people do it: The excitement of wanting to stay active in the market.
- Why it causes problems: Over-trading leads to high transaction costs and unnecessary losses.
- What you should do instead: Be selective. Only trade patterns that align with the broader market trend.
- Ignoring Risk Management:
- Why people do it: Blind faith that a pattern will never fail.
- Why it causes problems: A single failed trade without a stop-loss can wipe out weeks of gains.
- What you should do onstead: Always define your exit strategy and maximum acceptable loss before entering a trade.
- Trading Against the Major Trend:
- Why people do it: Trying to pick the exact top or bottom of a market move.
- Why it causes problems: Strong trends can continue much longer than expected.
- What you should do instead: Trade in the direction of the larger market trend for higher win rates.
Risks and Limitations
Understanding what can go wrong protects your capital.
- Subjectivity: Different traders interpret chart shapes slightly differently. What one person calls a Hammer, another might see as an ordinary candle.
- Lagging Nature: Candlestick patterns confirm what has happened, not what will happen.
- Capital Risk: No pattern eliminates financial risk. Markets can gap down overnight, bypassing your stop-loss limits. Always keep position sizes small relative to your total account size.
Decision-Making Framework
Use this simple step-by-step framework before executing any trade based on candlestick patterns:
- Identify the Trend: Is the asset in an overall uptrend, downtrend, or trading sideways?
- Spot the Key Level: Is the pattern forming near a significant support or resistance zone?
- Validate the Pattern: Does the candlestick formation match a reliable pattern like a Hammer or Engulfing candle?
- Check Confirmation: Has the subsequent price action confirmed the reversal signal?
- Define Your Risk: Where will you place your stop-loss if the trade goes against you?
- Calculate the Reward: Is the potential profit significantly higher than the risk you are taking?
- Execute and Monitor: Enter the trade only if all criteria align, and manage your position objectively.
Checklist for Trading Candlestick Patterns
Before entering a trade based on price action, verify the following points:
- [ ] The overall market trend is clearly identified.
- [ ] The candlestick pattern appears at a logical chart location (support/resistance).
- [ ] The pattern structure matches a well-known reliable formation.
- [ ] A confirmation candle has appeared or been accounted for.
- [ ] A strict stop-loss level is set to protect against sudden market shifts.
- [ ] The trade risk-to-reward ratio is favorable (at least 1:2).
Key Terms
- Bearish: Market conditions or price movements associated with falling prices.
- Bullish: Market conditions or price movements associated with rising prices.
- Support: A price level where a downtrend can pause due to a concentration of buying interest.
- Resistance: A price level where an uptrend can pause due to a concentration of selling interest.
- Stop-Loss: An order placed with a broker to sell an asset when it reaches a certain price, limiting potential losses.
- Wick: The thin line on a candlestick showing the highest and lowest prices reached during a timeframe.
FAQs
Are candlestick patterns guaranteed to work?
No. Candlestick patterns show probabilities, not certainties. Markets are influenced by unpredictable factors like news, economic reports, and sudden shifts in liquidity.
Which timeframe is best for trading candlestick patterns?
Daily and 4-hour charts are generally considered more reliable because they filter out minor market noise. Shorter timeframes (like 1-minute or 5-minute charts) produce many false signals.
Do I need to memorize dozens of patterns?
No. Mastering three to five core patterns (such as Hammers, Shooting Stars, and Engulfing patterns) is far more effective than trying to memorize dozens of obscure formations.
Can beginners trade using only candlestick patterns?
While candlesticks provide great visual clues, beginners should combine them with basic risk management, trend analysis, and support/resistance levels for better results.
What is the difference between a chart pattern and a candlestick pattern?
A candlestick pattern usually forms over one to three candles (short-term price action), whereas chart patterns (like Head and Shoulders or Double Bottoms) take many weeks or months to form across multiple price bars.
Conclusion
Candlestick patterns are powerful tools that translate raw market data into clear visual stories. By learning to recognize formations like the Hammer and Engulfing patterns, you gain insight into the ongoing struggle between buyers and sellers.
Remember that no single pattern guarantees success. True trading skill comes from combining these patterns with proper context, strict risk management, and patience. Practice reading charts without risking real money first, and always protect your capital as your most valuable asset.