Introduction
Markets do not move in straight lines. When the price of a stock, crypto, or commodity goes up for a long time, buyers eventually run out of steam, and sellers take over. But how do you know when a rising market is about to turn around?
Many investors use technical analysis—the study of past price movements—to find clues. Among the most trusted tools is the head and shoulders pattern.
While the name sounds unusual, the concept is simple. It represents a psychological battle between buyers and sellers where buyers lose their grip. This guide breaks down what the pattern means, how it works, and how you can spot it without getting confused by complicated jargon.
What Is the Head and Shoulders Pattern?
A chart pattern is a specific shape formed by price movements on a graph over time. The head and shoulders pattern is a reversal pattern, meaning it usually appears at the end of an upward trend and warns that prices are likely to head downward.
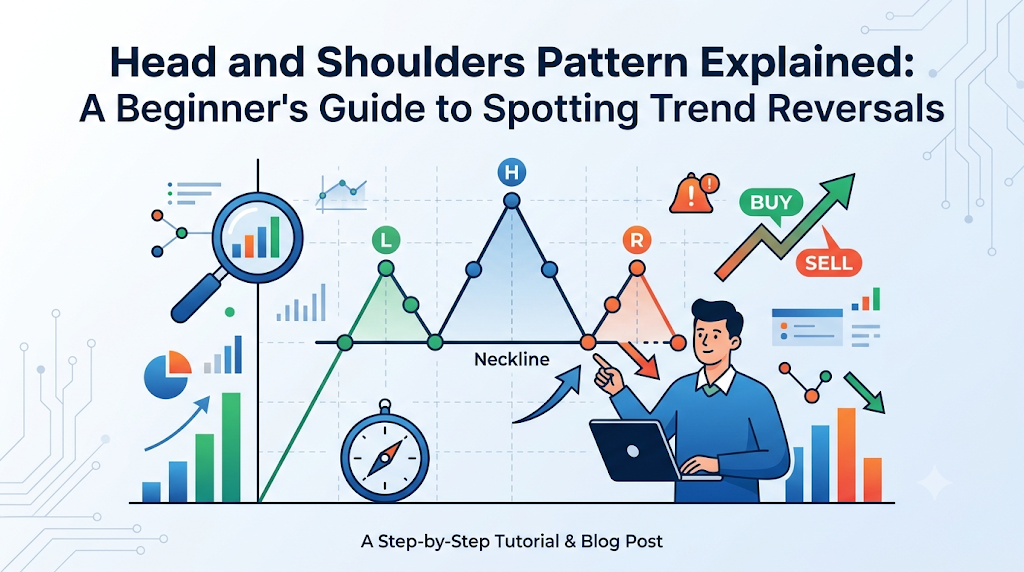
Think of it as a hill with two smaller hills on either side.
- Left Shoulder: Prices rise to a peak and then fall back down.
- The Head: Prices rise even higher than before, creating a taller peak, and then fall back down again.
- Right Shoulder: Prices rise one more time, but this time they only reach about the same height as the first shoulder before falling again.
- Neckline: A line drawn across the lowest points between the shoulders and the head. This acts as a floor or support level.
How the Head and Shoulders Pattern Works
To understand why this pattern happens, we have to look at market psychology—the mood and behavior of the people buying and selling.
1. The Left Shoulder (Strong Buyers)
The market is in a healthy upward trend. Buyers push prices up to a new high. Eventually, some early buyers decide to take their profits and sell. The price dips slightly, forming the left shoulder.
2. The Head (One Last Push)
Optimism returns. Buyers jump back in and push the price even higher than the previous peak. This creates the highest point, known as the “head.” However, because prices are now very high, hesitation sets in. Sellers step in, and the price drops back down to roughly the same level as the previous dip.
3. The Right Shoulder (Weakening Demand)
Buyers try one more time to push the market up, but they lack the energy they had before. Prices fail to reach the height of the head and stop at a lower peak. This forms the right shoulder. Buyers are getting tired, and sellers are taking control.
4. The Breakdown (Neckline Breach)
The crucial moment arrives when the price falls below the neckline (the support line connecting the recent lows). When this floor breaks, it proves that sellers have overpowered buyers. Panic can set in, leading to a faster drop in price.
Why the Head and Shoulders Pattern Matters
For investors and traders, recognizing this pattern early helps manage risk.
- Trend Identification: It signals the exact moment an uptrend might be turning into a downtrend.
- Exit Strategy: Long-term investors use it as a warning sign to sell assets before prices drop significantly.
- Entry Strategy: Short-term traders might use the breakdown below the neckline to place bets that the price will fall further.
Practical Example
Imagine you are tracking a popular stock that has been rising for six months, moving from $50 to $100.
- Left Shoulder: The stock hits $100 and drops back to $85.
- Head: It surges to $120 (the head) before selling pressure pushes it back down to $85.
- Right Shoulder: It rallies once more, but only reaches $102 before sliding again.
- The Neckline: The $85 mark has acted as a floor twice. When the price finally drops below $85, the head and shoulders pattern is complete. Traders view this break below $85 as a strong signal that the stock’s upward run is over.
Common Mistakes Beginners Make
Spotting patterns on a chart takes practice. Here are traps to avoid:
- Trading Too Early: Acting before the price officially breaks the neckline. Sometimes the right shoulder forms, but the price bounces back up instead of breaking down. Always wait for confirmation.
- Ignoring Volume: Trading volume is the number of shares or coins traded. When the right shoulder forms and the neckline breaks, volume should ideally increase. Low volume during a breakdown suggests a weak signal.
- Forcing the Pattern: Trying to see a head and shoulders pattern where it does not exist. If the peaks are wildly uneven or the shape looks messy, it is likely not a valid pattern.
Risks and Limitations
No technical pattern is 100% accurate. Markets are unpredictable, and false signals happen.
- False Breakdowns: The price might briefly dip below the neckline and then quickly bounce back up, trapping traders who sold too fast.
- Market Conditions: In a strong, booming market, bearish patterns can sometimes fail because overall buying pressure is simply too high.
- Subjectivity: Drawing the neckline can be subjective. Two traders might draw it slightly differently, leading to different decisions.
Inverse Head and Shoulders (The Bottom Reversal)
There is also a flip side to this pattern, known as the inverse (or upside-down) head and shoulders.
Instead of appearing at the top of a rising market, it appears at the bottom of a falling market. It features:
- A left shoulder pointing down.
- A lower head pointing down.
- A right shoulder pointing down.
When the price breaks above the neckline in this version, it signals that a downtrend is ending and an upward trend may be starting. It represents sellers running out of power and buyers stepping back in.
Decision-Making Framework
If you think you spot a head and shoulders pattern, follow these steps before taking action:
- Check the Prior Trend: Did a clear upward trend happen before the pattern formed? (A reversal pattern needs an established trend to reverse).
- Verify the Shape: Are the shoulders roughly balanced, and is the head clearly higher than both shoulders?
- Identify the Neckline: Can you draw a clear, horizontal or slightly sloped line connecting the lows?
- Wait for the Break: Has the price closed cleanly below the neckline?
- Check Volume: Is trading activity higher during the breakdown?
- Manage Risk: Decide where you will exit if the trade goes against you to protect your capital.
Checklist for Spotting Head and Shoulders
- Clear prior upward trend exists.
- Left shoulder peak forms and retraces.
- Higher head peak forms and retraces to a similar level as the first dip.
- Right shoulder peak forms at a lower height than the head.
- Neckline is clearly drawn connecting the reaction lows.
- Price breaks decisively below the neckline.
- Trading volume increases on the breakout.
Key Terms
- Chart Pattern: A distinct shape created by price movements on a financial chart that helps predict future direction.
- Trend Reversal: A change in the overall direction of a market price (from up to down, or down to up).
- Neckline: A support or resistance line drawn by connecting the lowest points of the pattern troughs.
- Trading Volume: The total number of shares or units traded during a specific period.
- Support: A price level where a stock tends to stop falling because buyers tend to enter the market.
- Resistance: A price level where a stock tends to stop rising because sellers tend to enter the market.
- Uptrend: A price movement characterized by higher peaks and higher troughs over time.
- Downtrend: A price movement characterized by lower peaks and lower troughs over time.
FAQs
What does a head and shoulders pattern look like?
It looks like three peaks on a price chart. The middle peak (the head) is the highest, while the two outer peaks (the shoulders) are lower and roughly equal in height. A line connecting the valleys between them is called the neckline.
Is the head and shoulders pattern always bearish?
The standard head and shoulders pattern is bearish, meaning it signals a drop in price. However, the inverse head and shoulders pattern is bullish, meaning it signals a rise in price from a market bottom.
How reliable is the head and shoulders pattern?
While it is one of the most widely recognized patterns in technical analysis, it is not foolproof. False breakouts can occur, which is why experienced traders wait for a confirmed break of the neckline and look at volume before making decisions.
What timeframes can I find this pattern on?
The head and shoulders pattern can appear on any timeframe, from minute-by-minute charts used by day traders to daily or weekly charts used by long-term investors. However, patterns on longer timeframes are generally considered more reliable.
What is the neckline in a head and shoulders pattern?
The neckline is a line drawn across the lowest points (troughs) that occur between the left shoulder and the head, and between the head and the right shoulder. It serves as a vital trigger level.
Do I need to buy special software to spot these patterns?
No. Most standard charting platforms and financial websites provide free tools that allow you to view price charts and draw trendlines.
What should I do if a breakout fails?
If the price breaks the neckline but quickly reverses and moves back inside the pattern, it is considered a failed breakout. Traders usually set stop-loss limits to exit the trade and minimize losses if this happens.
Can this pattern be used for cryptocurrency and forex?
Yes. Technical patterns like the head and shoulders apply to any liquid market where prices are driven by supply and demand, including stocks, cryptocurrencies, foreign exchange (forex), and commodities.
Conclusion
The head and shoulders pattern is a valuable tool for understanding shifts in market momentum. By learning to recognize the peaks, the head, and the neckline, you gain insight into when buyers are losing control and sellers are taking over.
Remember that no single chart pattern guarantees success. Always combine pattern recognition with proper risk management, patience, and a clear plan to protect your investments in changing markets.