Introduction
Looking at a raw price chart can feel confusing. Green and red bars jump up and down, prices spike unexpectedly, and the overall market often seems erratic.
Many new traders try to guess where prices will head next based on personal hopes, news headlines, or tips seen on social media. This habit often leads to painful losses. When personal money is on the line, guessing triggers panic, hesitation, and emotional mistakes like buying when prices are far too high or selling at the absolute bottom.
Price movement is rarely random noise. Financial markets behave like an open auction driven by human psychology: fear, greed, conviction, and doubt. When thousands of people, funds, and institutional desks trade a stock, currency, or commodity, their shared decisions leave recognizable visual footprints.
These footprints are known as chart patterns. Learning to spot the best chart patterns gives you a structured, repeatable method to navigate the market. Patterns do not predict the future with complete certainty. Instead, they provide clear reference points: a logical entry point, a protective exit if the trade fails, and a sensible target to take profits.
What Are Chart Patterns and Why Do They Form?
A chart pattern is a specific structure formed by historical price action over a given timeframe.
Markets move through an ongoing auction between two opposing forces:
- Buyers (Bulls): Market participants who believe an asset is undervalued or heading higher, pushing demand above available supply.
- Sellers (Bears): Market participants who want to lock in profits or bet on falling prices, increasing supply above demand.
When buyers outnumber sellers, prices climb in an uptrend. When sellers dominate, prices drop in a downtrend.
Trends do not move straight up or down. When an asset rises quickly, buyers eventually hesitate to pay higher prices, while earlier buyers start selling to collect profits. The price stalls. If sellers lack the strength to force prices downward, buyers return as soon as a minor discount appears.
This push-and-pull creates consolidation zones. Over hours, days, or weeks, these zones form geometric shapes on the chart. When price finally breaks through the boundaries of that shape, it tells you that one group has gained control. This breakout often triggers a powerful, sustained move.
The Two Core Families of Chart Patterns
Every major chart pattern belongs to one of two structural families:
1. Reversal Patterns
A reversal pattern signals that an ongoing trend has run out of momentum and is preparing to switch direction.
If a market has been rising for months and prints a reversal pattern, traders prepare for a downward move. If a market has been falling and forms a reversal pattern, traders prepare for an upward move.
An essential rule applies here: a reversal pattern requires an existing trend to reverse. If a double bottom appears in the middle of a sideways, trendless market, it holds very little technical significance.
2. Continuation Patterns
A continuation pattern signals that the market is pausing to digest a recent move before continuing in the same direction.
Think of a runner taking a brief breath during a long-distance race. The price moves sideways or pulls back slightly, builds trading interest, and then breaks out along the path of the original trend.
Continuation setups generally offer higher win rates for beginners because they follow the existing trend rather than fighting it.
Important Concepts to Understand First
Before looking at specific patterns, you need to understand four core market concepts:
- Support: A price floor where buying demand is strong enough to pause or reverse a downward move. When the price drops to this level, buyers step in and absorb the selling.
- Resistance: A price ceiling where selling supply is heavy enough to stop an upward move. When the price rallies to this level, sellers unload shares and cap further gains.
- Breakout: A decisive price move beyond a established support or resistance boundary. A valid breakout requires the body of the candlestick to close outside the pattern line, rather than just poking through it momentarily with a wick.
- Trading Volume: The total amount of shares or contracts traded during a specific time period. Volume represents conviction. A breakout supported by high volume indicates institutional participation, while a breakout on thin volume suggests a likely failure.
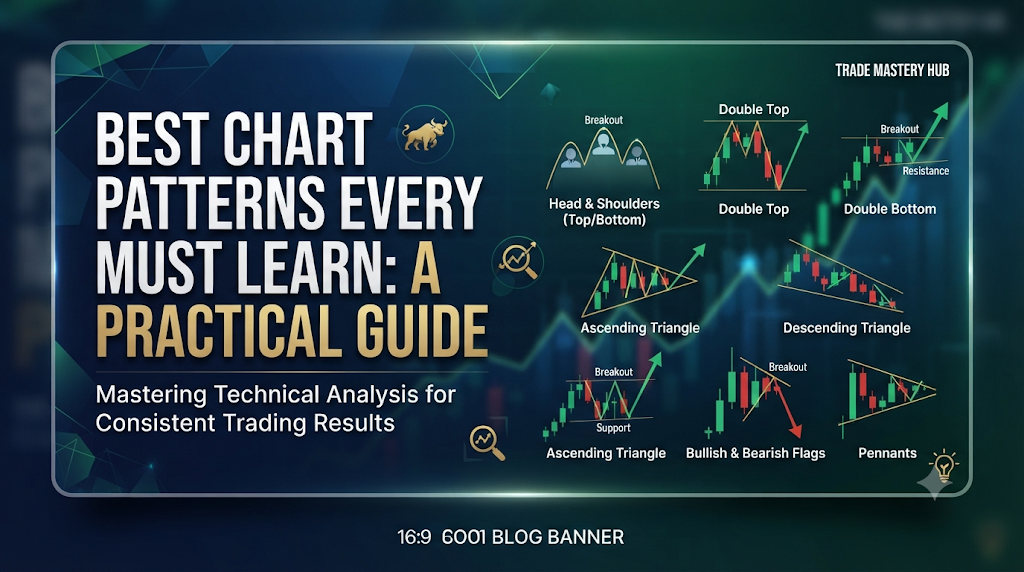
Top Reversal Patterns Every Trader Must Learn
1. Head and Shoulders (Bearish Reversal)
The Head and Shoulders pattern is one of the most reliable chart patterns for spotting the end of an uptrend.
How It Works
The pattern consists of four distinct stages:
- Left Shoulder: The price climbs to a new peak within an uptrend, pulls back, and finds temporary support.
- Head: Buyers push the price higher again, creating a higher peak that marks the highest point of the pattern. However, the subsequent drop pulls all the way back to the previous support line.
- Right Shoulder: Buyers make a final attempt to drive the market upward, but they run out of energy. The price peaks at a lower level than the head and begins to slide.
- The Neckline: A horizontal or slightly sloping support line drawn across the low points reached between the shoulders and the head.
When price drops through this neckline, the pattern is complete. It shows that buyers can no longer make higher highs or defend previous price floors.
Trade Execution Rules
- Entry: Open a short position when a candlestick closes below the neckline. More cautious traders wait for the price to break down, bounce up to retest the broken neckline from below, and fail to cross back over it.
- Stop-Loss: Place your protective stop-loss order slightly above the peak of the right shoulder.
- Profit Target: Measure the vertical distance from the peak of the head down to the neckline. Subtract that exact distance downward from the point where the price crossed the neckline.
2. Inverse Head and Shoulders (Bullish Reversal)
The Inverse Head and Shoulders is the upside-down equivalent of the Head and Shoulders pattern. It forms at the conclusion of a downtrend and signals that buyers are taking charge.
How It Works
The market forms a first low point (left shoulder), bounces up to establish a resistance ceiling (the neckline), and drops to an even lower trough (the head). A second bounce returns to the neckline, followed by a final pullback that forms a higher low (the right shoulder).
This higher low is the key visual clue. It proves that sellers are losing the strength required to push the asset down to new lows.
Trade Execution Rules
- Entry: Buy when a candle closes cleanly above the neckline resistance.
- Stop-Loss: Place your stop-loss just underneath the lowest point of the right shoulder.
- Profit Target: Measure the vertical distance from the bottom of the head up to the neckline. Project that same distance upward from the breakout point.
3. Double Top (Bearish Reversal)
A Double Top is an “M-shaped” reversal formation that shows up after an extended upward move.
How It Works
The price rises to a strong resistance level, drops back down to establish a temporary support floor, and makes a second rally toward the earlier high.
On this second attempt, buyers cannot push the price above the previous peak. Sellers actively defend the ceiling. As buying interest fades, price slides down toward the intermediate support floor, known as the neckline.
Trade Execution Rules
- Entry: Sell or enter a short position once a candle closes below the intermediate neckline.
- Stop-Loss: Position your stop-loss order above the second peak.
- Profit Target: Measure the height between the peaks and the neckline. Project that measurement downward from the breakdown point.
4. Double Bottom (Bullish Reversal)
A Double Bottom is a “W-shaped” pattern that appears at the base of a downtrend.
How It Works
The asset falls to a clear price floor, bounces up to set an intermediate resistance point, and falls back to test the previous low.
Sellers attempt to drive the market lower, but buyers absorb the supply at the exact same level as before. Price rebounds toward the intermediate peak. When the market breaks above this central peak, it confirms that sellers have exhausted their supply.
Trade Execution Rules
- Entry: Buy when a candle closes above the central neckline peak.
- Stop-Loss: Set your stop-loss slightly beneath the lower of the two bottom troughs.
- Profit Target: Calculate the vertical distance from the troughs to the neckline, and add that distance to the breakout level.
Top Continuation Patterns Every Trader Must Learn
1. Bull Flag and Bear Flag
Flags are among the most popular continuation setups in trading because they offer clear entries and tight risk limits.
How the Bull Flag Works
A Bull Flag features two main parts:
- The Flagpole: A sharp, aggressive price surge driven by heavy buying pressure over a short period.
- The Flag: A calm, compact consolidation channel that slopes gently downward against the primary trend.
During the flag phase, trading volume drops noticeably. This drop shows that large investors are not actively dumping shares; instead, earlier buyers are simply taking minor profits while waiting for fresh demand. When buyers return, the price breaks out through the upper channel line and sparks the next leg up.
The Bear Flag works identically in reverse: a steep drop forms the pole, followed by a slow, upward-sloping consolidation on low volume, which eventually breaks downward.
Trade Execution Rules
- Entry: For a Bull Flag, enter long when the price breaks and closes above the upper boundary of the flag channel.
- Stop-Loss: Place your stop-loss just below the lowest swing point within the flag consolidation.
- Profit Target: Measure the length of the initial flagpole. Project that full distance upward starting from the breakout point.
2. Symmetrical Triangle
A Symmetrical Triangle develops when the market forms lower swing highs and higher swing lows simultaneously.
How It Works
Both sides are active, but neither has complete control. Buyers step in at higher prices on every decline, while sellers step in at lower prices on every advance. This action funnels price into an increasingly narrow corner.
As the price approaches the tip of the triangle, trading volume typically drops to low levels as participants await a resolution. Once price breaks through either boundary line, built-up orders trigger a fast directional move. Symmetrical triangles most frequently break in the direction of the trend that preceded them.
Trade Execution Rules
- Entry: Enter in the direction of the breakout once a candlestick closes completely outside the converging boundary lines.
- Stop-Loss: Place your stop-loss just beyond the most recent internal swing level inside the triangle.
- Profit Target: Measure the vertical distance at the widest part of the triangle (the base), and project that distance from the breakout level.
3. Ascending and Descending Triangles
Unlike symmetrical triangles, these variations have one flat horizontal boundary and one sloping boundary, indicating that one side holds clear leverage.
Ascending Triangle (Bullish)
- Structure: A flat horizontal resistance ceiling on top and a rising support line along the bottom.
- Meaning: Sellers are willing to unload inventory at one specific price ceiling. Meanwhile, buyers are steadily raising their bids, buying every pullback at higher levels.
- Outcome: Eventually, the available supply at the resistance ceiling runs out, and buyers easily drive prices higher through the roof.
Descending Triangle (Bearish)
- Structure: A flat horizontal support floor along the bottom and a falling resistance line along the top.
- Meaning: Buyers are defending one flat price floor, but sellers are growing more aggressive on every bounce, accepting lower exit prices.
- Outcome: The buying floor eventually runs out of capital, support collapses, and the price drops rapidly.
Pattern Comparison Matrix
| Pattern Name | Setup Category | Required Prior Trend | Expected Breakout | Reliability Rating | Primary Confirmation Factor |
| Head and Shoulders | Reversal | Extended Uptrend | Downward | High | High volume on neckline break |
| Inverse Head & Shoulders | Reversal | Extended Downtrend | Upward | High | High volume on neckline break |
| Double Top | Reversal | Uptrend | Downward | Moderate to High | Low volume on 2nd peak, heavy on breakdown |
| Double Bottom | Reversal | Downtrend | Upward | Moderate to High | Decisive close above central neckline peak |
| Bull Flag | Continuation | Sharp Uptrend | Upward | High | Low volume in flag, expansion on breakout |
| Bear Flag | Continuation | Sharp Downtrend | Downward | High | Heavy sell volume breaking lower channel |
| Ascending Triangle | Continuation | Uptrend | Upward | Moderate to High | Clean candle close above flat resistance |
| Descending Triangle | Continuation | Downtrend | Downward | Moderate to High | Clean candle close below flat support |
| Symmetrical Triangle | Continuation / Neutral | Either Trend | With Breakout | Moderate | Volume spike as price exits the apex |
How to Trade Chart Patterns Step by Step
Follow this structured five-step routine on every trade setup to keep emotions from interfering with execution:
Step 1: Check the Broader Trend
Always determine what the higher timeframe is doing before taking a trade. If you trade on a 15-minute or 1-hour chart, check the daily chart first. Taking a bull flag breakout on a 15-minute chart right as the daily chart slams into major resistance creates an unnecessary disadvantage. Trade in alignment with the larger trend.
Step 2: Confirm Clear Boundary Touches
A valid pattern needs at least two distinct touches on both the support and resistance lines. If you have to bend trendlines or ignore several candles to make a shape fit, the pattern is not valid. Clear patterns attract broad institutional interest, which creates the momentum needed for a strong follow-through.
Step 3: Wait for a Confirmed Candle Close
Never enter while a breakout candle is still active. Intraday price spikes routinely pierce a resistance level, lure in eager traders, and reverse before the candle finishes forming, leaving behind a long wick. Wait until the candle closes fully outside the pattern boundary before placing your order.
Step 4: Check Volume for Real Commitment
Volume shows whether institutional desks are backing the move. When a breakout happens, look for a noticeable increase in volume compared to the previous 10 to 20 candles. If an asset drifts past a resistance line on low volume, treat it with caution.
Step 5: Define Invalidation and Position Size
Before placing an order, calculate your exit point if the setup fails, along with your profit target.
- Risk no more than 1% to 2% of your overall trading account on any single trade.
- Ensure your projected profit target is at least double your stop-loss distance to maintain a positive risk-to-reward ratio.
Realistic Trade Example: Trading a Bull Flag
Here is how a disciplined trader executes a classic Bull Flag setup:
- Asset: Shares of a mid-cap manufacturing stock trading on a daily chart.
- The Flagpole: Over two weeks, the stock rallies quickly from $50 to $65 on heavy institutional volume. This $15 surge forms the flagpole.
- The Flag Consolidation: Over the next seven trading sessions, the stock pulls back gently, drifting between $64 and $61. Volume drops to roughly one-third of its normal daily average, showing that sellers are not aggressively exiting.
- The Breakout: On the eighth day, a wide green candle pushes through the upper boundary of the flag at $63 and closes the session at $64. Volume surges to nearly double its 20-day average.
Calculating the Trade Setup
- Entry Point: $64.00 (entered on the confirmed daily candle close).
- Stop-Loss Level: $60.50 (placed just beneath the flag’s swing low of $61.00).
- Monetary Risk: $64.00 minus $60.50 equals $3.50 per share.
- Target Calculation: Add the flagpole height ($15.00) to the breakout level ($63.00), giving a target price of $78.00.
- Projected Profit: $78.00 minus $64.00 equals $14.00 per share.
- Risk-to-Reward Ratio: $3.50 risk versus $14.00 potential reward, which equals a 1:4 ratio.
With a 1:4 risk-to-reward ratio, you can win just 40% of your trades over time and still grow your account safely.
Why Patterns Fail and How to Manage the Risk
No chart pattern works every time. Depending on overall market conditions, standard chart setups fail roughly 25% to 40% of the time. Knowing how and why failures occur is what separates professional risk managers from losing traders.
Understanding the False Breakout (The Trap)
A false breakout happens when the price pushes through a pattern boundary, triggers entry orders from breakout traders, and immediately reverses back inside the structure.
This failure often stems from institutional liquidity requirements. Large funds trade in heavy sizes. If a bank wants to buy 500,000 shares of an asset without driving the market price out of reach, it needs an equal pool of active sellers.
The bank allows price to drop slightly below a widely followed support floor. As soon as the level breaks, retail traders dump their shares to cut losses, while automated systems initiate short positions.
The institutional fund steps in and buys up all those incoming sell orders at a favorable price. With the selling pressure absorbed, the price snaps back inside the pattern, trapping short traders in losing positions.
Rules to Minimize False Breakout Losses
- Always use a hard stop-loss order: Keep a live stop-loss order registered with your broker at all times. Never rely on a “mental stop.” If the market invalidates your pattern, take the planned loss and step aside.
- Consider the retest entry: Instead of buying the initial breakout candle, wait for the price to pull back and touch the broken boundary line from the other side. If old resistance holds as new support, enter on the bounce. You will miss a few fast-moving runners, but you will avoid the majority of false breakout traps.
- Avoid holding setups into major economic announcements: High-impact economic news, such as central bank interest rate decisions or quarterly corporate earnings, overrides technical patterns. Reduce position size or close open short-term pattern trades before these events occur.
Five Common Mistakes Beginners Make
1. Anticipating the Pattern Before It Finishes
Inexperienced traders often spot what looks like the left shoulder and head of a Head and Shoulders pattern and sell immediately, assuming the rest will complete. Markets often invalidate partial shapes and continue their primary trend. A chart pattern does not exist until the breakout level is crossed and confirmed.
2. Ignoring Higher-Timeframe Direction
A bullish ascending triangle on a 5-minute chart carries very little weight if the daily and weekly charts are in an aggressive downtrend. The higher timeframe always overrules the lower timeframe.
3. Forcing Patterns onto Messy Charts
If you have to adjust trendlines repeatedly or squint at the screen to see a double bottom, the pattern is not there. The most dependable setups are clean, obvious, and easily spotted by thousands of market participants at once.
4. Moving the Stop-Loss to Avoid Taking a Loss
When the market moves against an open position, struggling traders often push their stop-loss further away, hoping the price will recover. This mistake turns minor, planned losses into catastrophic account damage. When your pattern’s invalidation point is reached, accept that the setup has failed and exit.
5. Ignoring Trading Volume
Trading pattern breakouts without checking volume is trading blind. A breakout that occurs on low or falling volume is one of the most reliable warning signs of a false move.
Practical Trading Checklist
Review this checklist before executing any pattern-based trade:
- [ ] Market Context: Does this trade align with the trend on the next higher timeframe?
- [ ] Clean Geometry: Are there at least two distinct price touches on both the upper and lower boundary lines?
- [ ] Confirmed Close: Has the candle closed fully outside the pattern boundary on your primary trading timeframe?
- [ ] Volume Validation: Did trading volume expand significantly on the breakout candle compared to recent sessions?
- [ ] Stop-Loss Position: Is your protective stop-loss placed beyond the nearest structural swing level, risking no more than 1% to 2% of your account?
- [ ] Favorable Math: Does the profit target offer at least 1.5 to 2 times your chosen risk distance?
- [ ] Calendar Check: Are there high-impact earnings reports or central bank announcements scheduled within your planned holding window?
Key Terms Glossary
- Candlestick: A chart format displaying the open, high, low, and close prices for a set timeframe. The thick body shows the open and close, while the thin wicks show the high and low extremes.
- Consolidation: A sideways market phase where prices trade inside a bounded range, reflecting balance between buyers and sellers.
- Neckline: A support or resistance boundary connecting key pivot points in formations such as Double Tops or Head and Shoulders.
- Breakout: A price advance or decline that closes decisively past a pattern line or key technical level.
- Retest (Pullback): A price movement where the market returns to touch a recently broken support or resistance line to test whether the level holds from the opposite side.
- Stop-Loss Order: An automated order placed with a broker to close a position at a pre-set price, limiting the trader’s total loss if the market moves against them.
- Risk-to-Reward Ratio (R:R): A mathematical comparison comparing the amount risked on a trade against the expected profit target.
- False Breakout: A brief move outside a pattern boundary that fails to maintain momentum, quickly snapping back inside the structure and trapping breakout traders.
Frequently Asked Questions
Which chart pattern is the most reliable?
No pattern works every single time. However, Bull Flags and Head and Shoulders patterns are considered highly reliable across global markets because they offer clean invalidation points. Their profitability comes from their strong risk-to-reward ratios rather than a guaranteed win rate.
Which chart timeframe is best for trading patterns?
Chart patterns appear across all timeframes, from 1-minute charts to monthly charts. However, patterns on the daily, 4-hour, and 1-hour charts are far more dependable than those on 1-minute or 5-minute charts. Higher-timeframe patterns represent larger pools of capital, more participants, and substantially less market noise.
Can chart patterns be used for stocks, forex, and cryptocurrencies?
Yes. Chart patterns reflect human psychology and auction dynamics, which govern all liquid, freely traded assets. Whether you trade equities, currency pairs, or cryptocurrencies, the same structural mechanics of support, resistance, and consolidation apply.
What should I do if a pattern breaks out in the unexpected direction?
Triangles and channels occasionally break out against the prevailing trend. When this happens, do not fight the market to protect your original bias. Either trade the confirmed breakout in the direction it is moving, or step aside entirely and look for a cleaner setup on another asset.
How can I tell if a breakout is real or fake?
Look at two primary factors: the candlestick close and trading volume. A legitimate breakout typically features a wide-bodied candle closing cleanly outside the pattern line, backed by a significant surge in trading volume. False breakouts often leave behind long wicks outside the boundary while the body closes back inside on weak volume.
Should I buy immediately as the price crosses a pattern line?
Waiting for the candle to close is safer, particularly for beginners. Entering while the candle is still forming leaves you vulnerable to sudden reversals and long wicks. Waiting for a completed candle close or an explicit retest offers far better risk control.
How many chart patterns should a beginner learn first?
Avoid trying to trade every pattern at once. Start by mastering two core setups: one continuation pattern (such as the Bull Flag) and one reversal pattern (such as the Double Bottom). Track twenty to thirty trades using only those two setups to build your pattern recognition skills before adding more complex shapes.
Do automated trading algorithms make chart patterns useless?
No. Quantitative algorithms are programmed by developers who explicitly code support, resistance, and key liquidity zones into their software. Algorithms often trade around the exact price levels created by major chart patterns, making disciplined entries, volume checks, and stop-loss placement just as important today as in the past.
Conclusion
Chart patterns are not fortune-telling devices that guarantee successful trades. They are practical, visual tools that display the shifting balance of power between buyers and sellers.
To trade chart patterns successfully over the long run, keep three rules in mind:
- Respect market context: Always align your trades with the larger, higher-timeframe trend.
- Be patient with entries: Wait for the candlestick to close outside the pattern boundary, and look for volume confirmation before committing your funds.
- Control your downside: Accept that every pattern can fail. Always use a protective stop-loss, keep your position sizes manageable, and preserve your trading capital so you can trade another day.
Open your charting platform and review historical charts to identify these shapes. Once you can spot them comfortably, test your execution in a paper-trading simulator before trading with live capital.