Introduction
Picture this scenario: You have been watching a stock for weeks. It keeps hitting a price ceiling near $100 and falling back down. Suddenly, heavy trading activity hits, and the price shoots up to $102. Excited that the stock is finally breaking out of its trading range, you buy shares quickly.
Minutes or hours later, the price reverses. It drops back below $100, falls sharply, and leaves you sitting on a quick loss.
What just happened? You fell victim to a fake breakout.
For beginners and intermediate investors alike, fake breakouts are one of the most frustrating traps in the stock market. Market makers, institutional investors, and algorithmic trading programs often use these false moves to catch everyday traders off guard.
This guide will teach you what fake breakouts are, why they happen, how to spot them before they trap your capital, and how you can trade smarter using professional confirmation techniques.
What Is a Fake Breakout in Stocks?
A breakout occurs when a stock’s price moves decisively outside a recognized chart pattern, such as a trading range, resistance ceiling, or support floor. Traders typically view this as a signal that the stock is starting a strong new trend in the direction of the breakout.
A fake breakout (or false breakout) is a temporary price movement that pushes past a technical level—like resistance or support—only to reverse course immediately and trap traders on the wrong side of the market.
Why It Matters
When a breakout is real, it can lead to fast, profitable price momentum. When it is fake, it often triggers stop-loss orders, causing a sudden cascade of selling or buying pressure that punishes breakout buyers. Recognizing the difference is the line between consistent trading success and constant frustration.
How Breakouts Work and Why Fakeouts Happen
To understand fakeouts, you need to understand the mechanics behind price levels.
The Psychology of Support and Resistance
- Resistance: A price ceiling where selling pressure is strong enough to stop the price from rising further. Many market participants place sell orders or short positions here.
- Support: A price floor where buying pressure is strong enough to stop the price from falling further.
When a stock approaches resistance, short-term traders watch closely. If the price pushes past that ceiling, buy stop-orders are triggered automatically, and breakout traders rush in to buy.
However, large institutional investors often need high liquidity to buy or sell large blocks of shares. They may push the price just past resistance to trigger those buy orders, creating artificial demand, and then sell their shares to the trapped retail buyers. Once the big players finish selling, the price collapses back into its old range.
Key Warning Signs to Identify Fake Breakouts
Experienced traders do not guess whether a breakout is real; they look for objective clues. Here are the most reliable warning signs that a breakout is fake:
1. Low Trading Volume
Volume measures the total number of shares traded during a specific period.
- Real Breakout: Accompanied by high volume, showing that institutional buyers or a large wave of market participants are actively supporting the move.
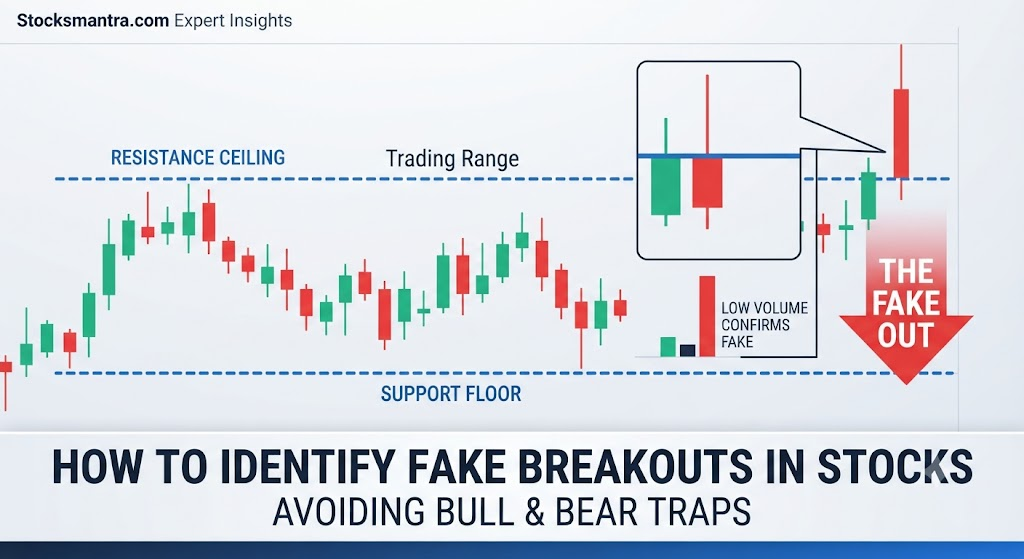
- Fake Breakout: Happens on low or average volume. If a stock breaks resistance while trading fewer shares than usual, it means large market players are not participating. Without institutional backing, the move usually fails.
2. Lack of Confirmation on Candlestick Closes
Many beginners panic-buy the moment a price touches or briefly pokes through a resistance line during the middle of a trading day.
- The Wick Trap: A stock might spike above $100 to $102 for ten minutes, leaving a long “wick” on the price chart, but close the day back down at $99.50.
- The Solution: Always wait for a daily or hourly candlestick to close firmly outside the breakout level. A close shows commitment; a momentary spike is often just noise.
3. Divergence in Momentum Indicators
Momentum indicators like the Relative Strength Index (RSI) or Moving Average Convergence Divergence (MACD) track the speed of price changes.
- If a stock makes a new high (breaking resistance), but the RSI makes a lower high, it signals bearish divergence.
- This means upward momentum is fading even as the price creeps higher—a classic warning sign of a fakeout.
4. Resistance Near Major Moving Averages or Higher Timeframes
If a stock is breaking out on a 5-minute chart, but crashing into a massive multi-year resistance line on the daily or weekly chart, the daily chart wins. Higher timeframe levels hold much more weight and frequently turn small breakouts into fakeouts.
Practical Examples of Fake Breakouts
Example 1: The Bull Trap in a Consolidating Stock
Imagine Company XYZ has traded sideways between $40 and $50 for six months.
- The Setup: On a Tuesday morning, news breaks about a minor product update. The stock jumps to $52.
- The Trap: Retail traders see the stock breaking its $50 ceiling and buy aggressively. However, volume is below average. By Thursday, the hype fades, no new buyers step in, and profit-takers sell. The stock drops back to $48.
- The Result: The buyers at $52 are trapped, watching their positions turn into losses as the stock returns to its old range.
Example 2: The Bear Trap (Fake Breakdown)
A bear trap is the exact opposite—a fake breakdown below support.
- The Setup: A stock drops below a long-held support level of $80 down to $77, scaring nervous investors into selling their shares in a panic.
- The Reality: Smart money steps in at $77, absorbing all the panic selling. Within two days, the price shoots back above $80, leaving the panicked sellers behind while the stock climbs toward $90.
Real-World Considerations and Operational Challenges
Spotting fake breakouts requires discipline because markets are designed to trick human emotions.
- Slippage and Execution Costs: If you react too slowly while waiting for confirmation, you may experience slippage—getting filled at a worse price than expected.
- False Positives vs. Missed Moves: If you demand too much confirmation, you might miss out on fast, legitimate breakouts. Trading is always a balance between risk management and catching opportunity.
- Market Conditions Matter: In a strong, booming bull market, fake breakouts happen less frequently because overall buying pressure pushes most stocks higher. In a choppy, sideways market, fake breakouts happen constantly.
Common Mistakes Traders Make
| What People Do | Why They Do It | Why It Causes Problems | What They Should Do Instead |
| Buying instantly on a price spike | Fear of missing out (FOMO) on a fast-moving stock. | Catches you right at the peak before a quick reversal. | Wait for volume confirmation and a candle close. |
| Ignoring overall market direction | Focusing only on an individual stock chart. | Trading a breakout against a crashing broader market index. | Check if the overall market (like the S&P 500 or Nifty) supports the trade. |
| Setting tight stop-losses right below resistance | Trying to minimize potential financial loss. | Algorithms hunt these exact stop levels, triggering a fakeout to grab liquidity. | Place stop-losses below logical market structures, not random lines. |
| Trading every single breakout pattern | Believing every breakout leads to a massive rally. | Overtrading leads to constant small losses that drain your account. | Be selective; trade only setups with high volume and strong catalysts. |
Risks and Limitations
No technical analysis tool is 100% accurate. Even with high volume and clear candlestick closes, unexpected news headlines, macroeconomic events, or sudden sector rotations can turn a real breakout into a fakeout instantly.
Always accept that risk is a permanent part of trading. Managing your position size ensures that a single fake breakout cannot damage your overall portfolio.
A Step-by-Step Decision-Making Framework to Verify Breakouts
Before you risk capital on a stock breaking a key level, run through this simple checklist:
- Check the Trend: Is the stock moving in the same direction as the broader market trend? (Trading with the trend increases your odds of success).
- Inspect the Volume: Is the volume significantly higher than the 20-day average during the breakout? (If no, be cautious).
- Wait for the Close: Has the candle closed firmly outside the resistance or support line on your chosen timeframe?
- Look for a Retest: Did the stock break out, pull back to test the old resistance level (now acting as new support), and hold? (The retest is often the safest entry point).
- Define Your Risk: Where will you exit if the breakout fails? If the distance to your stop-loss is too wide, skip the trade.
Key Terms Explained
- Bull Trap: Another name for a fake upside breakout that traps buyers before prices fall.
- Bear Trap: A fake downside breakdown that traps short sellers before prices rise.
- Consolidation: A period when a stock price moves sideways within a defined high and low range, building energy for its next major move.
- Liquidity: The ease with which shares of a stock can be bought or sold without causing drastic price swings.
- Retest: When a stock breaks a technical level, pulls back to touch that exact level again, and then continues in its original breakout direction.
- Wick: The thin line on a candlestick chart showing the highest or lowest price reached during a trading period, even if the price did not close there.
Frequently Asked Questions
What is the difference between a real breakout and a fake breakout?
A real breakout is backed by high trading volume, follows through with consecutive closes outside the level, and often includes a successful retest. A fake breakout occurs on low volume, quickly reverses back into the prior range, and traps aggressive buyers or sellers.
How can I avoid falling into a bull trap?
The best defense is patience. Do not buy the exact moment a stock touches a resistance level. Wait for the daily candle to close above resistance on high volume, or wait for a pullback and retest of the breakout zone.
Do fake breakouts happen more in small-cap or large-cap stocks?
Fake breakouts happen in all stocks, but they are more common in low-volume small-cap stocks where it is easier for large orders to temporarily skew prices. Large-cap stocks with heavy institutional participation tend to produce cleaner, more reliable breakouts.
What is a retest, and why is it important for spotting fakeouts?
A retest happens when a stock breaks resistance, falls back briefly to touch that same line, and bounces higher. If the old resistance level successfully holds as new support during the retest, it confirms that buyers are defending the move, making the breakout much more trustworthy.
Can technical indicators completely prevent me from trading fakeouts?
No indicator is flawless. Indicators like RSI or volume give you probability clues, but they cannot predict the future with 100% certainty. Risk management—such as using stop-loss orders—is always required.
Why do institutional traders cause fake breakouts?
Institutions trade massive share sizes. To buy millions of shares without driving the price up too fast, they sometimes push prices past key technical levels to trigger retail buy orders, giving them the liquidity they need to execute their trades.
Conclusion
Fake breakouts are an inevitable part of the stock market, designed to test the patience and discipline of traders. When you rush in blindly based on a single price spike, you become the liquidity that institutional players rely on.
By demanding confirmation—checking for high trading volume, waiting for strong candlestick closes, and watching for successful retests—you can dramatically filter out false moves. Protect your capital, be patient with your entries, and let the market prove its intentions before you commit your hard-earned money.