Introduction
Many new traders look at financial charts and feel overwhelmed. They see screens filled with colorful lines, zig-zag patterns, histograms, and complex mathematical formulas. It often feels like learning a secret foreign language just to place a simple trade.
However, some of the most experienced traders in the world use almost none of these extra tools. Instead, they look at clean charts that show only the price history. This approach is known as price action trading.
Price action strips away the noise. It treats price movement as the ultimate reflection of all market information, buyer demand, and seller pressure. This guide explains what price action trading is, how it works, why traders use it, and what you need to watch out for if you want to try it.
What Is Price Action Trading?
Price action trading is a style of financial trading where a trader makes decisions based primarily on the movement of a security’s price over time.
Instead of relying on lagging technical indicators—which calculate past data to predict future moves—price action traders look directly at the footprints left by buyers and sellers on a price chart.
Why Does It Matter?
Think of a busy marketplace. If three people want to buy a rare item and only one person wants to sell, the price goes up. If ten people want to sell and nobody wants to buy, the price drops.
Price action is simply the digital record of this constant tug-of-war between supply and demand. By watching how price behaves at important price levels, traders can gauge market psychology and make educated guesses about where the market might head next.
How Price Action Trading Works
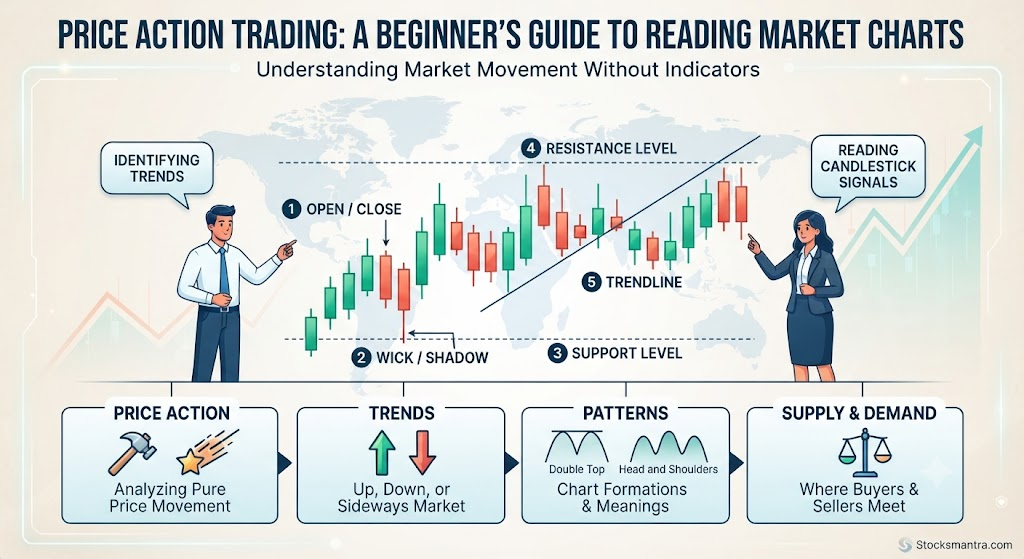
To understand price action, you need to look at how prices are displayed on a chart. Most price action traders prefer candlestick charts because each candle tells a clear story about a specific timeframe—whether that is one minute, one hour, or one day.
The Anatomy of a Price Bar
Every price bar or candlestick shows four vital pieces of information:
- Open: The price when the time period began.
- High: The highest price reached during that period.
- Low: The lowest price reached during that period.
- Close: The price when the time period ended.
When the close is higher than the open, buyers won that round, and the candle is usually colored green or white. When the close is lower, sellers won, and the candle is colored red or black.
Reading Market Structure
Price action is not about guessing randomly; it is about reading market structure. Markets generally move in three ways:
- Uptrend: Making higher highs and higher lows. Buyers are in control.
- Downtrend: Making lower lows and lower highs. Sellers are in control.
- Range (Consolidation): Moving sideways between a clear ceiling (resistance) and floor (support). Neither buyers nor sellers have control.
Why Traders Use Price Action
Many traders move away from indicator-heavy charts and adopt price action for several key reasons:
- No Lag: Indicators use past data to calculate future outputs, meaning they are always reacting to what already happened. Price action happens in real-time.
- Simplicity: A clean chart reduces mental clutter and confusion, helping traders make faster, clearer decisions.
- Universal Application: Price action principles work across different markets—whether you trade stocks, forex, commodities, or cryptocurrencies—because human psychology remains consistent across all markets.
- Clear Risk Management: Price action makes it easy to spot logical places to set stop-loss orders (to limit losses) based on recent swing highs and lows.
Important Concepts in Price Action
If you want to practice price action trading, you must understand a few core building blocks.
Support and Resistance
Support and resistance are invisible lines on a chart where buying or selling pressure historically enters the market.
- Support: A price floor where falling prices tend to slow down or bounce because buyers step in.
- Resistance: A price ceiling where rising prices tend to stall or reverse because sellers step in.
Example: Imagine a stock keeps falling to $50 and then bounces back up three times in a row. That $50 mark is a support level.
Candlestick Patterns
Price action traders look for specific candle shapes that signal potential market turns.
- Pin Bar: A candle with a long “wick” or “tail” and a small body. It shows that prices pushed aggressively in one direction but were forcefully rejected by the opposing side.
- Engulfing Pattern: A large candle that completely overtakes the body of the previous smaller candle, signaling a sudden shift in momentum.
Practical Example: Reading a Support Bounce
Imagine you are watching a company’s stock. Over the past month, the stock price fell to $100 twice, and both times buyers rushed in, pushing the price back up.
Now, the price drops to $100 for a third time. Instead of buying immediately, a price action trader waits to see how the price behaves at that exact level. They notice a small candle form with a long bottom wick, showing that sellers tried to push the price below $100, but buyers quickly stepped in and drove the price back up before the candle closed.
This rejection at support gives the trader a clear signal that buyers are defending that price, helping them decide to enter a trade with a defined risk level just below the $100 mark.
Real-World Considerations and Challenges
While price action sounds straightforward, mastering it takes patience and discipline. Here is what you need to consider in the real world:
- Subjectivity: Two traders can look at the exact same chart and draw support lines in slightly different places. There is no single “correct” formula.
- False Breakouts: Prices frequently break past support or resistance levels briefly to trap emotional traders before reversing sharply in the opposite direction.
- Emotional Control: Because price action requires active decision-making without the comfort of automated indicator signals, beginner traders often struggle with patience and discipline.
Common Mistakes Beginners Should Make
- Trading Every Pattern: Beginners often try to trade every single pin bar or breakout they see.
- Why it happens: Excitement and a desire to be active.
- Why it causes problems: Most random patterns fail without the context of the broader market trend.
- What to do instead: Only take trades that align with the major trend and occur at major support or resistance levels.
- Ignoring Overall Market Context: Trading a bullish reversal pattern while the overall market is in a sharp downtrend.
- Why it happens: Focusing too much on a single candle.
- Why it causes problems: Fighting the wider market trend usually leads to losses.
- What to do instead: Always check the higher timeframe trend before placing a trade.
- Placing Stops Too Close: Setting stop-loss limits right next to the entry price.
- Why it happens: Trying to minimize potential financial loss on a single trade.
- Why it causes problems: Normal market breathing room will trigger the stop-loss before the trade has a chance to work.
- What to do instead: Place stop-losses safely behind logical structural points like recent swing lows.
Risks and Limitations
Every trading style carries risk. Price action is no exception. Because it relies heavily on visual interpretation, it is vulnerable to human error and emotional bias.
Furthermore, sudden macroeconomic news events—such as unexpected interest rate hikes or geopolitical conflicts—can shatter clean technical patterns instantly, causing rapid slippage and unexpected losses. Always use proper position sizing and risk management to protect your capital.
Decision-Making Framework for Price Action Traders
Before entering any trade using price action, walk through this simple checklist:
- Identify the Trend: Are we in an uptrend, downtrend, or sideways range?
- Find Key Levels: Where are the major daily or hourly support and resistance zones?
- Wait for the Trigger: Does a clear price action signal (like a pin bar or rejection) form at that key level?
- Define Risk: Where will you exit if the trade goes wrong? (Set your stop-loss).
- Calculate Reward: Is the potential reward high enough compared to the risk you are taking?
Key Terms
- Candlestick: A visual representation of price movement over a specific timeframe, showing open, high, low, and close prices.
- Support: A price level where demand is strong enough to prevent the price from falling further.
- Resistance: A price level where selling pressure is strong enough to prevent the price from rising further.
- Trend: The general direction in which a market is moving over time.
- Pin Bar: A single candlestick with a long tail indicating price rejection.
- Breakout: When a price moves decisively outside a defined support or resistance boundary.
- Consolidation: A period where the price moves sideways within a narrow range.
- Stop-Loss: An order placed to automatically close a losing trade at a predetermined price level.
FAQs
Is price action trading better than using indicators?
Neither is universally better. Indicators provide mathematical calculations that some traders find helpful, while price action offers clean, unfiltered data. Many professional traders combine a clean price action chart with one or two simple reference tools, such as moving averages or volume.
Can beginners learn price action trading?
Yes. In fact, starting with price action can help beginners understand core market dynamics faster because they learn how supply and demand drive prices, rather than blindly trusting black-box indicators.
Do I need expensive software for price action trading?
No. Most standard charting platforms provide clean candlestick charts with drawing tools for support and resistance lines completely free of charge.
How long does it take to master price action?
Mastering price action requires consistent screen time, journaling trades, and reviewing past market behavior. It typically takes months or years of dedicated practice to develop strong visual recognition and emotional discipline.
Does price action work in all markets?
Yes. Price action principles apply to any liquid market where buyers and sellers exchange assets, including stocks, forex, indices, and cryptocurrency.
Conclusion
Price action trading cuts through market noise by focusing entirely on the raw interaction between buyers and sellers. By learning to read clean charts, identifying major support and resistance levels, and waiting for clear price signals, you can develop a logical, structured approach to the markets. Remember that simplicity, patience, and strict risk management are your best tools for long-term consistency.