Introduction
Imagine you are driving up a steep hill. You press the gas pedal, but your car loses momentum and rolls back down. You try climbing the hill a second time, but the engine struggles again at the exact same spot and gives up completely. Frustrated, you turn around and drive down.
In financial markets, price charts behave in a very similar way. When buyers try twice to push a price past an invisible ceiling and fail, the market often loses its energy and turns downward.
For beginners, learning how to read price charts can feel like trying to decode a foreign language. Squiggly lines, green and red bars, and technical terms can easily overwhelm anyone. However, some of the most reliable tools on a chart are also the simplest to spot.
This guide breaks down the Double Top and Double Bottom formations. You will learn what they look like, why they happen, how to trade them safely, and the common traps that catch everyday traders off guard.
What Is a Double Top and Double Bottom?
At their core, these are reversal patterns. In trading, a reversal means the prevailing direction of the price is about to change.
To understand them, you need to know two basic terms:
- Support: An imaginary floor where falling prices tend to stop falling because buyers step in.
- Resistance: An imaginary ceiling where rising prices tend to stop rising because sellers step in.
The Double Top Pattern
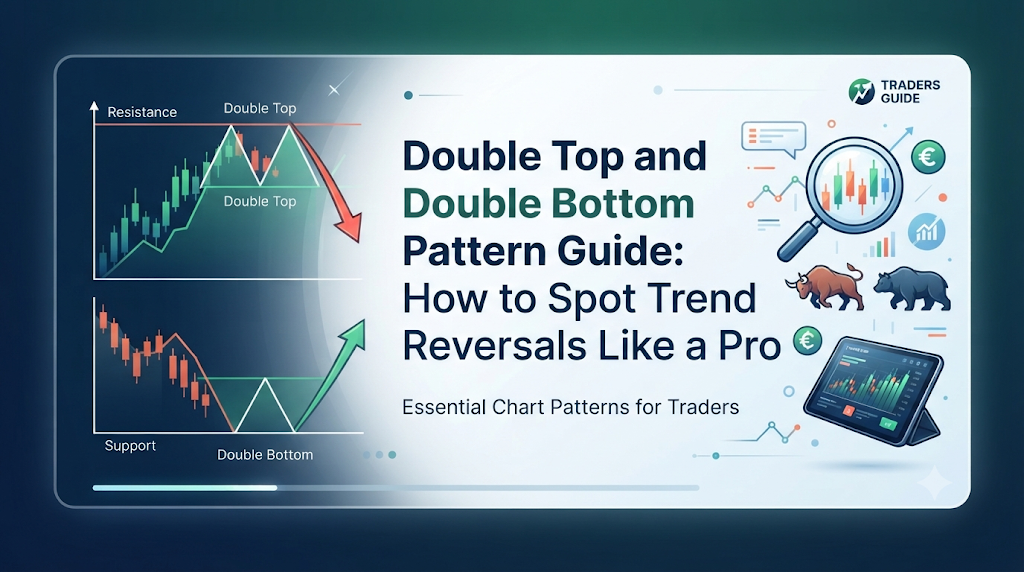
A Double Top is a bearish (falling market) formation. It occurs during an uptrend when the price climbs to a high point, pulls back slightly, climbs back up to that exact same high point, and then breaks downward through the middle support level.
The Double Bottom Pattern
A Double Bottom is a bullish (rising market) formation. It occurs during a downtrend when the price drops to a low point, bounces up slightly, drops back down to that same low point, and then breaks upward through the middle resistance level.
How These Patterns Work
Markets are driven by the eternal tug-of-war between buyers (bulls) and sellers (bears). These formations tell the story of that battle.
1. The Anatomy of a Double Top
- The First Peak: Buyers are in control, pushing the asset price higher. Eventually, the price reaches a point where profit-taking begins and sellers step in, creating a high point (Peak 1).
- The Pullback (Neckline): Disappointed buyers step back, and the price drops to a temporary low. This low point forms the base of the “M,” commonly called the neckline.
- The Second Peak: Optimistic buyers return, believing the uptrend is continuing. They push the price back up toward the previous high. However, sellers are waiting at that exact same price level to unload their shares.
- The Breakdown: The price fails to make a new high. Sellers overwhelm the buyers, and the price plunges below the neckline, confirming the pattern.
2. The Anatomy of a Double Bottom
- The First Trough: Sellers dominate, driving the price downward. It hits a floor where value-seeking buyers step in, creating a low point (Trough 1).
- The Bounce (Neckline): Sellers push back briefly, but lose steam. The price bounces upward to a minor peak, creating the middle point of the “W,” known as the neckline.
- The Second Trough: Sellers make one more push to drive the price down to the previous low. But this time, buyers are waiting in force at that support level.
- The Breakout: Sellers realize they cannot push the price any lower. Buyers take over, pushing the price upward and past the neckline, signaling a new uptrend.
Why These Formations Matter
These visual signals matter because they provide an objective roadmap in a chaotic market. Instead of guessing where a stock or cryptocurrency might go, traders use these setups to define clear boundaries:
- Entry Point: Tells you precisely when the market sentiment has truly shifted.
- Risk Management: Gives you a logical place to exit if the trade goes wrong.
- Profit Target: Gives you a mathematical way to estimate how far the price might travel.
Without a framework like this, trading becomes pure gambling based on emotion rather than a structured decision-making process.
Detailed Explanation: Key Components
To use these formations effectively, you must understand their underlying moving parts.
The Neckline
The neckline is the horizontal or slightly slanted line connecting the valley of a Double Top or the peak of a Double Bottom. A pattern is not officially valid until the price breaks through the neckline. Many beginners make the mistake of trading the formation while it is still forming, only to watch the price break out in the opposite direction.
Volume Analysis
Volume refers to the total number of shares or contracts traded during a specific period.
- In a Double Top, trading volume is usually higher on the first peak and lower on the second peak. This decreasing volume shows that buyers are running out of steam.
- In a Double Bottom, volume often spikes when the price breaks above the neckline, confirming that institutional buyers are aggressively entering the market.
Practical Examples
Let’s look at two realistic, hypothetical examples to see how these formations play out in real life.
Example 1: The Tech Stock Double Top
Imagine a popular technology stock called Apex Corp is in a strong uptrend, rising from $100 to $150.
- At $150, sellers flood the market, and the stock pulls back to $130.
- A few weeks later, buyers rally the stock back up to $150. However, enthusiasm is lower, and the stock struggles to break past $150.
- Frustrated buyers abandon ship, and the price drops below the $130 neckline.
- The Result: The stock confirms a Double Top. Traders who recognized the failure at $150 and the breakdown at $130 can short-sell the stock or exit their long positions to protect their capital.
Example 2: The Retail Chain Double Bottom
Imagine a retail company stock has been sliding during a harsh economic quarter, dropping from $80 down to $50.
- At $50, bargain hunters view the stock as cheap and step in, driving the price up to $65.
- Bad news hits the sector, and the stock falls back down to $50. But this time, it refuses to drop below $50. Sellers are exhausted.
- Buyers surge back in, driving the price past the $65 neckline.
- The Result: A Double Bottom is confirmed. Investors who bought near $50 or waited for the $65 breakout capture a strong upward swing as the stock recovers.
Common Mistakes Beginners Should Make
Even experienced traders occasionally fall into traps. Here are the most frequent mistakes and how to avoid them:
- Jumping the Gun: Entering a trade before the price actually breaks the neckline.
- Why they do it: They want to catch the exact top or bottom for maximum profit.
- Why it fails: The second peak or trough can fail, and the trend can continue.
- What to do instead: Wait for a confirmed candle close beyond the neckline before making a move.
- Ignoring the Broader Trend: Trading a Double Bottom in the middle of a massive, long-term bear market without checking overall economic health.
- Why they do it: They rely on isolated chart patterns.
- Why it fails: Strong downward trends easily crush weak reversal signals.
- What to do instead: Trade reversals that align with larger market conditions or major support and resistance zones.
- Ignoring Stop-Loss Orders: Failing to set an exit point if the market moves against the position.
- Why they do it: Overconfidence in the pattern working out.
- Why it fails: Markets can be unpredictable; false breakouts happen frequently.
- What to do instead: Always place a stop-loss just above the second peak (for shorts) or just below the second trough (for longs).
Risks and Limitations
No chart pattern is right 100% of the time. Relying blindly on any single indicator is a fast track to losing money.
- False Breakouts: Sometimes, a price will dip below a Double Top neckline for a few hours, tricking traders into selling, only to rocket right back up. This is known as a bull trap (or bear trap in a bottom formation).
- Subjectivity: Drawing necklines requires human judgment. Two traders might look at the same chart and draw slightly different support and resistance lines.
- Market Noise: Short-term price fluctuations can create messy formations that look like a “M” or “W” on a 5-minute chart but mean nothing on a daily or weekly chart.
Comparison: Double Top vs. Double Bottom
| Feature | Double Top | Double Bottom |
| Market Trend Prior | Uptrend | Downtrend |
| Market Direction After | Bearish (Down) | Bullish (Up) |
| Visual Shape | Letter “M” | Letter “W” |
| Key Level | Support (Neckline) | Resistance (Neckline) |
| Trader Action | Sell / Short | Buy / Long |
Decision-Making Framework
Before executing a trade based on a Double Top or Double Bottom, walk through this simple step-by-step framework:
- Identify the Trend: Is the asset clearly in an uptrend (for tops) or a downtrend (for bottoms)?
- Verify the Peaks/Troughs: Are the two high or low points roughly at the same price level?
- Draw the Neckline: Connect the valley or peak clearly between the two points.
- Wait for Confirmation: Has a candle closed clearly past the neckline?
- Calculate Risk-to-Reward: Measure the height of the pattern (from the peak/trough to the neckline). Project that same distance from the breakout point to set your profit target. Is the potential reward significantly higher than your risk?
- Set Stop-Loss: Place your safety stop-loss just past the invalidation point (above the second peak or below the second trough).
- Execute and Monitor: Manage the trade calmly according to your plan without letting emotions take over.
Checklist
Use this quick checklist before taking action on any chart setup:
- Did I verify the pattern on a reliable timeframe (daily or 4-hour charts work better than minute charts)?
- Is the volume behavior consistent with a reversal (higher on the first move, lower on the second)?
- Has the price definitively closed past the neckline?
- Have I calculated my profit target using the height of the pattern?
- Is my stop-loss clearly defined to protect my capital?
Key Terms
- Support: A price level where a falling asset tends to find buying interest.
- Resistance: A price level where a rising asset tends to encounter selling pressure.
- Neckline: The critical horizontal level connecting the internal swing high or low of a pattern, marking the trigger point for a breakout.
- Breakout: When a price moves decisively outside a defined support or resistance boundary.
- Stop-Loss: An automatic order placed with a broker to close a losing trade at a predetermined price.
- Volume: The total amount of an asset traded during a given timeframe, used to measure market conviction.
- Reversal: A significant change in the direction of an asset’s price trend.
- Bullish: Market conditions or sentiment anticipating rising prices.
- Bearish: Market conditions or sentiment anticipating falling prices.
FAQs
1. What timeframes work best for spotting Double Tops and Bottoms?
These formations work on almost any timeframe, from 1-minute charts to monthly charts. However, formations found on higher timeframes (like daily or weekly charts) are generally more reliable and produce stronger price movements than those on short intraday charts.
2. How do I calculate my profit target using these patterns?
Measure the vertical distance from the highest peak (in a Double Top) or lowest trough (in a Double Bottom) down to the neckline. Then, project that exact same distance downward (for a top) or upward (for a bottom) from the breakout point on the neckline.
3. What happens if a Double Top fails?
If the price breaks above the second peak instead of falling through the neckline, the pattern has failed. This usually triggers a powerful continuation of the prior uptrend, catching traders who shorted the asset too early off guard.
4. Are Double Tops and Bottoms suitable for complete beginners?
Yes, because they rely on visual geometry that is easy to recognize. However, beginners should practice identifying them on historical charts (backtesting) using a demo account before risking real money.
5. Do these formations only apply to stocks?
No. Double Tops and Bottoms appear in any liquid market where prices are driven by supply and demand, including cryptocurrencies, forex currencies, commodities, and index funds.
6. Why is volume so important when trading these setups?
Volume shows institutional participation. If a breakout past a neckline happens on very low volume, it often indicates a lack of market conviction, increasing the likelihood of a false breakout.
7. Can a Double Top or Bottom be slanted instead of perfectly flat?
Yes. Sometimes the second peak or trough is slightly higher or lower than the first. While a level neckline is ideal, slight angles are normal in real-world markets as long as the general psychology of failed momentum remains intact.
Conclusion
The Double Top and Double Bottom formations are powerful tools for understanding market psychology. They turn chaotic price swings into structured opportunities by highlighting where momentum is fading and where the crowd is changing direction.
Remember that no single pattern guarantees success. Combine these setups with strict risk management, patience, and proper neckline confirmation. By mastering these fundamentals, you can approach the markets with greater confidence, discipline, and clarity.