Introduction
Distributed Tracing Tools help teams track and visualize requests as they flow across multiple services in a distributed system. In modern architectures built on microservices, APIs, and cloud-native infrastructure, a single user request can pass through dozens of services. Distributed tracing provides end-to-end visibility, enabling teams to understand performance bottlenecks and system dependencies.
Unlike basic monitoring, distributed tracing answers critical questions like where latency occurs and which service caused a failure. With the rise of Kubernetes, serverless computing, and OpenTelemetry standards, tracing tools have become a core component of observability strategies. They enable faster debugging, improved performance, and better system reliability.
Real-World Use Cases
- Tracing user requests across microservices
- Identifying latency bottlenecks
- Debugging production issues
- Visualizing service dependencies
- Optimizing distributed system performance
What Buyers Should Evaluate
- Support for distributed tracing standards (OpenTelemetry)
- Integration with logs and metrics
- Visualization and service maps
- Real-time tracing and alerting
- Scalability for high-volume systems
- Ease of instrumentation
- Cloud and Kubernetes support
- Cost and data ingestion model
Best for: DevOps teams, SREs, backend developers, and organizations running microservices-based architectures.
Not ideal for: Simple monolithic applications with minimal service interactions.
Key Trends in Distributed Tracing Tools
- Adoption of OpenTelemetry as a standard
- Integration with full observability platforms
- AI-driven root cause analysis
- Real-time tracing and analytics
- Cloud-native and Kubernetes-first tracing
- Increased focus on developer experience
- Integration with CI/CD and DevSecOps workflows
- High-cardinality data analysis
- Cost optimization for telemetry data
- Visualization improvements for service dependencies
How We Selected These Tools (Methodology)
- Industry adoption and popularity
- Strong distributed tracing capabilities
- Integration with observability ecosystems
- Scalability for large distributed systems
- Performance and reliability signals
- Security and compliance considerations
- Active community or vendor support
- Balance between open-source and enterprise tools
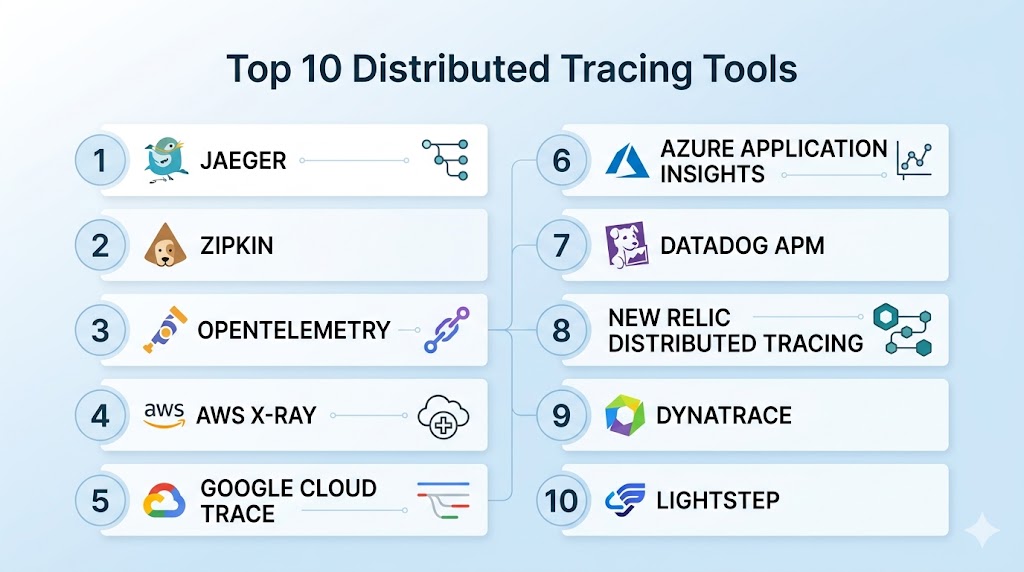
Top 10 Distributed Tracing Tools
#1 — Jaeger
Short description: An open-source distributed tracing system designed for monitoring microservices.
Key Features
- End-to-end request tracing
- Service dependency visualization
- Performance monitoring
- Open-source
- Integration with Kubernetes
Pros
- Free and open-source
- Strong cloud-native support
Cons
- Requires setup
- Limited built-in analytics
Platforms / Deployment
Linux / Cloud
Self-hosted
Security & Compliance
Not publicly stated
Integrations & Ecosystem
- Kubernetes
- Prometheus
- OpenTelemetry
Support & Community
Strong open-source community.
#2 — Zipkin
Short description: A lightweight open-source tracing system for collecting and analyzing latency data.
Key Features
- Distributed tracing
- Latency analysis
- Service dependency tracking
- Lightweight architecture
- Open-source
Pros
- Easy to deploy
- Simple architecture
Cons
- Limited advanced features
- Basic UI
Platforms / Deployment
Windows / macOS / Linux
Self-hosted
Security & Compliance
Not publicly stated
Integrations & Ecosystem
- Spring Cloud
- OpenTelemetry
Support & Community
Active community.
#3 — OpenTelemetry
Short description: An open standard for collecting telemetry data including traces, metrics, and logs.
Key Features
- Standardized instrumentation
- Multi-language support
- Vendor-neutral
- Extensible architecture
- Integration with observability tools
Pros
- Industry standard
- Flexible and extensible
Cons
- Not a standalone UI tool
- Requires integration
Platforms / Deployment
Multi-platform
Cloud / Self-hosted
Security & Compliance
Not publicly stated
Integrations & Ecosystem
- Observability platforms
- Cloud services
Support & Community
Large global community.
#4 — AWS X-Ray
Short description: A managed tracing service for applications running on AWS.
Key Features
- End-to-end tracing
- Service maps
- Performance analysis
- Integration with AWS services
- Real-time insights
Pros
- Fully managed
- Seamless AWS integration
Cons
- Vendor lock-in
- Limited outside AWS
Platforms / Deployment
Web
Cloud
Security & Compliance
IAM, encryption
Not publicly stated
Integrations & Ecosystem
- AWS services
- Lambda
- EC2
Support & Community
Enterprise support.
#5 — Google Cloud Trace
Short description: A distributed tracing system for applications running on Google Cloud.
Key Features
- Latency tracking
- Service maps
- Integration with GCP
- Real-time monitoring
- Performance insights
Pros
- Easy cloud integration
- Scalable
Cons
- Limited outside GCP
- Pricing considerations
Platforms / Deployment
Web
Cloud
Security & Compliance
IAM, encryption
Not publicly stated
Integrations & Ecosystem
- Google Cloud services
- Kubernetes
Support & Community
Enterprise support.
#6 — Azure Application Insights
Short description: A monitoring and tracing tool integrated with Azure for application performance insights.
Key Features
- Distributed tracing
- Performance monitoring
- Real-time alerts
- Integration with Azure services
- Visualization dashboards
Pros
- Strong Microsoft ecosystem
- Integrated observability
Cons
- Azure dependency
- Configuration complexity
Platforms / Deployment
Web
Cloud
Security & Compliance
RBAC, encryption
Not publicly stated
Integrations & Ecosystem
- Azure services
- DevOps tools
Support & Community
Enterprise support.
#7 — Datadog APM
Short description: A cloud-native APM tool with strong distributed tracing capabilities.
Key Features
- Distributed tracing
- Real-time monitoring
- Service maps
- AI-driven insights
- Integration with observability
Pros
- Unified observability
- Strong integrations
Cons
- Expensive
- Pricing complexity
Platforms / Deployment
Web
Cloud
Security & Compliance
RBAC, audit logs
Not publicly stated
Integrations & Ecosystem
- AWS
- Kubernetes
- CI/CD tools
Support & Community
Strong enterprise support.
#8 — New Relic Distributed Tracing
Short description: A tracing solution integrated into New Relic’s observability platform.
Key Features
- Distributed tracing
- Real-time insights
- Service maps
- Integration with APM
- Custom dashboards
Pros
- Developer-friendly
- Strong analytics
Cons
- Data ingestion costs
- Complex UI
Platforms / Deployment
Web
Cloud
Security & Compliance
RBAC, encryption
Not publicly stated
Integrations & Ecosystem
- Cloud platforms
- DevOps tools
Support & Community
Strong documentation.
#9 — Dynatrace
Short description: An enterprise platform with AI-driven tracing and observability.
Key Features
- Distributed tracing
- AI root cause analysis
- Service mapping
- Performance monitoring
- Automation
Pros
- Strong automation
- Deep insights
Cons
- Expensive
- Learning curve
Platforms / Deployment
Web
Cloud / Hybrid
Security & Compliance
RBAC, audit logs
Not publicly stated
Integrations & Ecosystem
- Cloud platforms
- Kubernetes
Support & Community
Enterprise support.
#10 — Lightstep
Short description: A cloud-native tracing platform focused on high-scale distributed systems.
Key Features
- Distributed tracing
- Real-time insights
- Service maps
- OpenTelemetry integration
- Performance monitoring
Pros
- Strong tracing capabilities
- Cloud-native
Cons
- Paid solution
- Limited ecosystem
Platforms / Deployment
Web
Cloud
Security & Compliance
Not publicly stated
Integrations & Ecosystem
- OpenTelemetry
- Kubernetes
Support & Community
Enterprise support.
Comparison Table (Top 10)
| Tool Name | Best For | Platform(s) Supported | Deployment | Standout Feature | Public Rating |
|---|---|---|---|---|---|
| Jaeger | Open-source | Linux | Self-hosted | Service maps | N/A |
| Zipkin | Lightweight | Multi-OS | Self-hosted | Simplicity | N/A |
| OpenTelemetry | Standard | Multi-OS | Hybrid | Vendor-neutral | N/A |
| AWS X-Ray | AWS users | Web | Cloud | Managed tracing | N/A |
| GCP Trace | GCP users | Web | Cloud | Scalability | N/A |
| Azure Insights | Azure users | Web | Cloud | Integration | N/A |
| Datadog | Cloud teams | Web | Cloud | Full observability | N/A |
| New Relic | Dev teams | Web | Cloud | Analytics | N/A |
| Dynatrace | Enterprise | Web | Hybrid | AI insights | N/A |
| Lightstep | High-scale | Web | Cloud | OpenTelemetry | N/A |
Evaluation & Scoring of Distributed Tracing Tools
| Tool Name | Core | Ease | Integrations | Security | Performance | Support | Value | Weighted Total |
|---|---|---|---|---|---|---|---|---|
| Jaeger | 9 | 7 | 8 | 7 | 9 | 8 | 10 | 8.5 |
| Zipkin | 8 | 8 | 7 | 7 | 8 | 8 | 10 | 8.2 |
| OpenTelemetry | 9 | 7 | 10 | 8 | 9 | 9 | 10 | 9.0 |
| AWS X-Ray | 9 | 8 | 9 | 9 | 9 | 9 | 8 | 8.8 |
| GCP Trace | 9 | 8 | 8 | 9 | 9 | 8 | 8 | 8.6 |
| Azure Insights | 9 | 8 | 9 | 9 | 9 | 9 | 8 | 8.8 |
| Datadog | 10 | 8 | 10 | 9 | 9 | 9 | 7 | 9.0 |
| New Relic | 9 | 8 | 9 | 9 | 8 | 9 | 8 | 8.7 |
| Dynatrace | 10 | 7 | 9 | 10 | 9 | 9 | 7 | 9.0 |
| Lightstep | 9 | 7 | 8 | 8 | 9 | 8 | 7 | 8.3 |
How to interpret scores:
These scores compare tools based on tracing capabilities, usability, and value. Higher scores indicate strong overall performance, but the best tool depends on your infrastructure. Open-source tools offer flexibility, while enterprise tools provide automation and deeper insights.
Which Distributed Tracing Tool Is Right for You?
Solo / Freelancer
Zipkin and Jaeger are lightweight and cost-effective.
SMB
New Relic and Datadog provide ease of use and scalability.
Mid-Market
OpenTelemetry with Jaeger offers flexibility.
Enterprise
Dynatrace and AWS X-Ray provide deep insights and automation.
Budget vs Premium
- Budget: Jaeger, Zipkin
- Premium: Dynatrace, Datadog
Feature Depth vs Ease of Use
- Feature-rich: Dynatrace
- Easy-to-use: New Relic
Integrations & Scalability
- Best integrations: OpenTelemetry
- Scalable: AWS X-Ray
Security & Compliance Needs
- Strong security: Dynatrace
- Moderate: Jaeger
Frequently Asked Questions (FAQs)
What is distributed tracing?
It tracks requests across multiple services in a system.
Why is distributed tracing important?
It helps identify bottlenecks and failures.
Do tracing tools support microservices?
Yes, they are designed for microservices.
Are they open-source?
Some tools are open-source, others are paid.
Do they integrate with CI/CD?
Yes, integration is common.
Can small teams use them?
Yes, especially open-source tools.
What data do they collect?
Trace data, latency, and service interactions.
Are they secure?
Most include security features.
What is OpenTelemetry?
A standard for telemetry data collection.
What is the best tracing tool?
Depends on your environment and needs.
Conclusion
Distributed Tracing Tools are essential for understanding and optimizing modern distributed systems. By providing end-to-end visibility into request flows, these tools help teams identify bottlenecks, troubleshoot issues, and improve performance. Whether you choose open-source solutions like Jaeger or enterprise platforms like Dynatrace and Datadog, the right tool depends on your scale, infrastructure, and budget. As systems grow more complex, adopting distributed tracing is critical for maintaining reliability and delivering seamless user experiences. Start by evaluating your needs, testing a few tools, and integrating them into your observability strategy for maximum impact.