Complete Guide to Actively Managed Equity Funds in India: Best Plans, Pros & Cons
1. What is Actively Managed Funds Investing in Stocks? Actively managed funds investing in stocks are mutual funds where professional […]
1. What is Actively Managed Funds Investing in Stocks? Actively managed funds investing in stocks are mutual funds where professional […]
What is Equity Mutual Fund? Equity Mutual Funds are investment schemes that pool money from multiple investors to invest primarily […]
What is RBI Bonds (Floating Rate Savings Bonds)? RBI Bonds (Floating Rate Savings Bonds) are government securities issued by the […]
Investing in high-interest, tax-free schemes for girl children in India is a strategic approach to secure their future, particularly for […]
What is Sukanya Samriddhi Yojana (SSY)? Sukanya Samriddhi Yojana (SSY) is a government-backed savings scheme in India aimed at the […]
1. What is a 5-year lock-in FD eligible for Section 80C deductions? A 5-year lock-in FD eligible for Section 80C […]
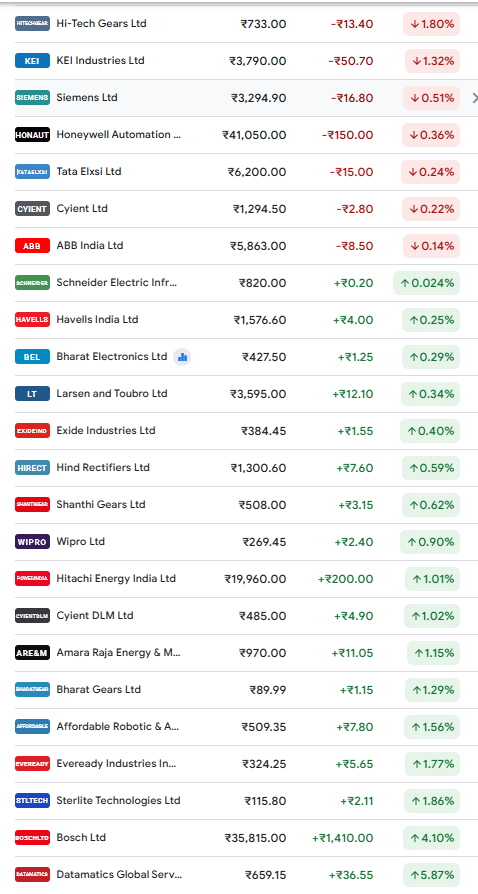
Based on comprehensive research across multiple sources, here is the definitive, up-to-date list of companies in India designing and manufacturing […]
SWOT Analysis for Bosch Ltd Based on comprehensive financial analysis, market positioning, and industry dynamics, here is a detailed SWOT […]
Based on comprehensive financial analysis, SWOT evaluation, and current market dynamics, here’s the definitive investment recommendation among India’s top metal […]
SWOT Analysis for Avalon Technologies Limited Based on comprehensive research across financial performance, market positioning, competitive landscape, and industry dynamics, […]
SWOT Analysis for Affordable Robotic & Automation Ltd (ARAPL) Based on comprehensive research and analysis of the company’s financial performance, […]
Based on comprehensive research across multiple sources, I have identified 37 companies in India that manufacture materials used in robot […]
Materials for Robot Manufacturing and Frame Structures: Comprehensive Predictions and Analysis Executive Summary Robot manufacturing materials are undergoing a fundamental […]
Based on my research across multiple sources, I have compiled a comprehensive list of Indian companies that are genuinely manufacturing […]
Based on comprehensive research across multiple sources, I have compiled the most complete and up-to-date list of companies in India […]
Based on comprehensive research across multiple sources, here is the definitive list of companies in India involved in actuator manufacturing, […]
Thank you for pointing out the need for updated content. I have now conducted comprehensive research across 2025 sources to […]
Based on comprehensive analysis of both companies’ emerging technology investments, financial performance, and growth prospects, Cyient Ltd emerges as the […]
Here is a comprehensive, up-to-date list of companies in India—publicly listed on NSE/BSE (directly or via key component supply)—involved in […]
Components Required for Robot Manufactoring Manufacturing robots, particularly as of mid-2024, involves a complex interplay of various components, technologies, and […]