Introduction
Diagramming tools are software applications used to create visual representations of systems, processes, workflows, and structures. These tools help translate complex ideas into clear visuals such as flowcharts, mind maps, UML diagrams, network diagrams, and organizational charts.
As businesses and technical teams increasingly rely on visual communication, diagramming tools have become essential across product development, IT architecture, operations, and education. Modern tools now go beyond static diagrams, offering real-time collaboration, AI-assisted diagram creation, integrations with development workflows, and cloud-based accessibility.
Common use cases include:
- Process mapping and workflow visualization
- Software architecture and UML diagrams
- Network and infrastructure diagrams
- Organizational charts and planning
- Brainstorming and mind mapping
Key evaluation criteria buyers should consider:
- Ease of use and learning curve
- Diagram types supported (flowcharts, UML, etc.)
- Collaboration and real-time editing
- Template availability
- Integration with other tools
- Performance with complex diagrams
- Export formats and sharing options
- Version control and history tracking
- Security and access controls
Best for: Product managers, developers, IT teams, business analysts, educators, and operations teams.
Not ideal for: Users who need advanced graphic design or illustration—design tools are better suited.
Key Trends in Diagramming Tools
- AI-assisted diagram creation: Auto-generating diagrams from text prompts
- Real-time collaboration: Multiple users editing simultaneously
- Cloud-first platforms: Browser-based diagramming tools
- Integration with development tools: Linking diagrams with code and systems
- Interactive diagrams: Clickable and dynamic elements
- Template-driven workflows: Faster diagram creation
- Cross-platform accessibility: Desktop + web + mobile support
- Version control and history tracking: Essential for teams
- Automation and smart connectors: Reducing manual work
- Embedded diagrams in workflows: Integration into docs and project tools
How We Selected These Tools (Methodology)
- Evaluated market adoption across business and technical teams
- Assessed diagram variety and flexibility
- Reviewed collaboration and cloud capabilities
- Considered ease of use for beginners vs professionals
- Included tools for individuals, SMBs, and enterprises
- Analyzed integration with productivity and developer ecosystems
- Evaluated performance with complex diagrams
- Reviewed template availability and customization
- Balanced free, freemium, and enterprise-grade tools
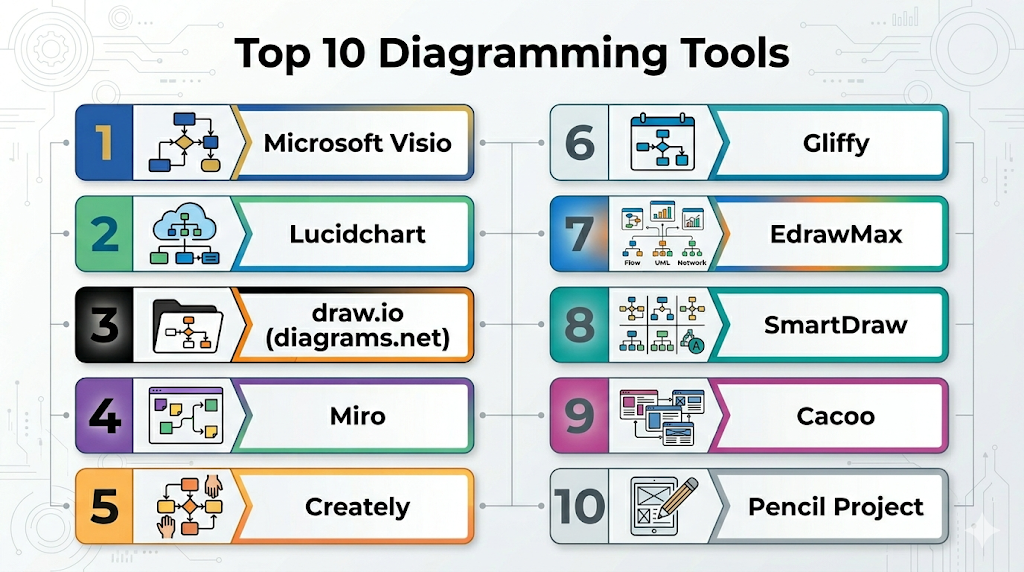
Top 10 Diagramming Tools
#1 — Microsoft Visio
Short description: A professional diagramming tool widely used for business processes, IT systems, and technical diagrams.
Key Features
- Extensive diagram templates
- Advanced shape libraries
- Data-linked diagrams
- Flowcharts and UML support
- Integration with productivity tools
- Collaboration features
Pros
- Enterprise-grade capabilities
- Strong integration ecosystem
Cons
- Expensive
- Steeper learning curve
Platforms / Deployment
Windows / Web
Cloud / Local
Security & Compliance
Not publicly stated
Integrations & Ecosystem
Part of a productivity ecosystem.
- Office suite integration
- Cloud storage
- Data connections
Support & Community
Strong enterprise support and community.
#2 — Lucidchart
Short description: A cloud-based diagramming tool focused on collaboration and ease of use.
Key Features
- Real-time collaboration
- Drag-and-drop interface
- Templates and shape libraries
- Integration with productivity tools
- Data visualization
- Version history
Pros
- Easy to use
- Excellent collaboration
Cons
- Subscription pricing
- Limited offline support
Platforms / Deployment
Web
Cloud
Security & Compliance
Not publicly stated
Integrations & Ecosystem
Strong integration ecosystem.
- Google Workspace
- Microsoft tools
- APIs
Support & Community
Large user base.
#3 — draw.io (diagrams.net)
Short description: A free and open-source diagramming tool with strong integration options.
Key Features
- Free and open-source
- Multiple diagram types
- Cloud and local storage options
- Integration with cloud platforms
- Custom shapes
- Offline support
Pros
- Completely free
- Flexible deployment
Cons
- Basic UI
- Limited advanced automation
Platforms / Deployment
Web / Desktop
Cloud / Local
Security & Compliance
Not publicly stated
Integrations & Ecosystem
Flexible integrations.
- Cloud storage
- Plugins
Support & Community
Large open-source community.
#4 — Miro
Short description: A collaborative whiteboard platform with diagramming capabilities for teams.
Key Features
- Infinite canvas
- Real-time collaboration
- Templates for workflows
- Sticky notes and brainstorming tools
- Integration with project tools
- Presentation mode
Pros
- Great for collaboration
- Versatile use cases
Cons
- Not focused on technical diagrams
- Performance issues with large boards
Platforms / Deployment
Web / Desktop / Mobile
Cloud
Security & Compliance
Not publicly stated
Integrations & Ecosystem
Team collaboration ecosystem.
- Project management tools
- Communication tools
Support & Community
Large global adoption.
#5 — Creately
Short description: A visual collaboration and diagramming tool with real-time editing features.
Key Features
- Real-time collaboration
- Multiple diagram types
- Smart connectors
- Templates
- Visual workspace
- Data linking
Pros
- Easy collaboration
- Flexible workspace
Cons
- Limited advanced features
- Subscription required
Platforms / Deployment
Web / Desktop
Cloud / Local
Security & Compliance
Not publicly stated
Integrations & Ecosystem
Collaboration-focused.
- Export tools
- Integrations
Support & Community
Moderate support.
#6 — Gliffy
Short description: A simple diagramming tool often used within project management platforms.
Key Features
- Drag-and-drop interface
- Flowcharts and diagrams
- Templates
- Integration with tools
- Easy sharing
Pros
- Easy to use
- Lightweight
Cons
- Limited advanced features
- Smaller ecosystem
Platforms / Deployment
Web
Cloud
Security & Compliance
Not publicly stated
Integrations & Ecosystem
Basic integrations.
- Project tools
- Export tools
Support & Community
Moderate support.
#7 — EdrawMax
Short description: A comprehensive diagramming tool supporting a wide range of diagram types.
Key Features
- 200+ diagram types
- Templates and symbols
- Cross-platform support
- Data visualization
- Export options
- Collaboration tools
Pros
- Wide feature set
- Good for multiple use cases
Cons
- Interface complexity
- Paid plans
Platforms / Deployment
Windows / macOS / Linux / Web
Cloud / Local
Security & Compliance
Not publicly stated
Integrations & Ecosystem
Broad ecosystem.
- Export tools
- Templates
Support & Community
Growing user base.
#8 — SmartDraw
Short description: A diagramming tool focused on automation and intelligent formatting.
Key Features
- Auto-formatting diagrams
- Templates
- Flowcharts and org charts
- Integration with productivity tools
- Data import
- Collaboration
Pros
- Automation features
- Easy to use
Cons
- Limited customization
- Subscription required
Platforms / Deployment
Web / Windows
Cloud / Local
Security & Compliance
Not publicly stated
Integrations & Ecosystem
Business workflows.
- Office tools
- Cloud storage
Support & Community
Moderate support.
#9 — Cacoo
Short description: A cloud-based diagramming tool designed for team collaboration.
Key Features
- Real-time collaboration
- Templates
- Comments and feedback
- Version history
- Integration with tools
Pros
- Good for teams
- Easy sharing
Cons
- Limited advanced features
- Subscription pricing
Platforms / Deployment
Web
Cloud
Security & Compliance
Not publicly stated
Integrations & Ecosystem
Team workflows.
- Project tools
- Export tools
Support & Community
Moderate support.
#10 — Pencil Project
Short description: An open-source diagramming and prototyping tool for simple use cases.
Key Features
- Free and open-source
- Basic diagramming tools
- UI prototyping
- Templates
- Cross-platform
Pros
- Free
- Lightweight
Cons
- Limited features
- Outdated interface
Platforms / Deployment
Windows / macOS / Linux
Local
Security & Compliance
Not publicly stated
Integrations & Ecosystem
Minimal ecosystem.
- Export tools
Support & Community
Small but active community.
Comparison Table (Top 10)
| Tool Name | Best For | Platform(s) Supported | Deployment | Standout Feature | Public Rating |
|---|---|---|---|---|---|
| Visio | Enterprise | Win/Web | Hybrid | Data-linked diagrams | N/A |
| Lucidchart | Teams | Web | Cloud | Collaboration | N/A |
| draw.io | Free users | Multi-platform | Hybrid | Open-source | N/A |
| Miro | Collaboration | Multi-platform | Cloud | Infinite canvas | N/A |
| Creately | Teams | Multi-platform | Hybrid | Visual workspace | N/A |
| Gliffy | Simplicity | Web | Cloud | Ease of use | N/A |
| EdrawMax | Versatility | Multi-platform | Hybrid | Diagram variety | N/A |
| SmartDraw | Automation | Multi-platform | Hybrid | Auto-formatting | N/A |
| Cacoo | Teams | Web | Cloud | Collaboration | N/A |
| Pencil Project | Open-source | Multi-platform | Local | Free tool | N/A |
Evaluation & Scoring of Diagramming Tools
| Tool Name | Core (25%) | Ease (15%) | Integrations (15%) | Security (10%) | Performance (10%) | Support (10%) | Value (15%) | Weighted Total |
|---|---|---|---|---|---|---|---|---|
| Visio | 10 | 6 | 10 | 5 | 9 | 9 | 7 | 8.6 |
| Lucidchart | 9 | 9 | 9 | 5 | 8 | 9 | 8 | 8.5 |
| draw.io | 8 | 8 | 7 | 5 | 7 | 8 | 10 | 8.0 |
| Miro | 8 | 10 | 8 | 5 | 7 | 9 | 8 | 8.2 |
| Creately | 8 | 9 | 7 | 5 | 7 | 7 | 8 | 7.8 |
| Gliffy | 7 | 9 | 6 | 5 | 7 | 7 | 7 | 7.3 |
| EdrawMax | 9 | 7 | 7 | 5 | 8 | 7 | 8 | 8.0 |
| SmartDraw | 8 | 9 | 7 | 5 | 8 | 7 | 8 | 7.9 |
| Cacoo | 7 | 9 | 7 | 5 | 7 | 7 | 8 | 7.6 |
| Pencil Project | 6 | 7 | 5 | 5 | 6 | 6 | 10 | 6.8 |
How to interpret the scores:
- Higher scores indicate better overall capability
- Enterprise users should prioritize integrations and core features
- Beginners should prioritize ease of use
- Free tools often score high in value
- Choose based on workflow complexity
Which Diagramming Tool Is Right for You?
Solo / Freelancer
- Best options: draw.io, Pencil Project
- Focus on affordability and simplicity
SMB
- Best options: Lucidchart, Creately
- Balance collaboration and features
Mid-Market
- Best options: Miro, EdrawMax
- Need flexibility and scalability
Enterprise
- Best options: Visio, Lucidchart
- Require integration and advanced features
Budget vs Premium
- Budget: draw.io, Pencil Project
- Premium: Visio, Lucidchart
Feature Depth vs Ease of Use
- Advanced: Visio, EdrawMax
- Easy: Miro, Lucidchart
Integrations & Scalability
- Strong: Visio, Lucidchart
- Limited: standalone tools
Security & Compliance Needs
- Most tools: Not publicly stated
- Enterprises should validate internally
Frequently Asked Questions (FAQs)
What is a diagramming tool?
Software used to create visual representations of processes and systems.
Which tool is best for beginners?
Lucidchart and Miro are easy to start with.
Are there free diagramming tools?
Yes, draw.io and Pencil Project are free.
What types of diagrams can I create?
Flowcharts, UML diagrams, org charts, network diagrams, and more.
Can teams collaborate on diagrams?
Yes, many tools support real-time collaboration.
Do these tools work offline?
Some tools like draw.io offer offline support.
Which tool is best for technical diagrams?
Visio and EdrawMax are strong options.
Can I export diagrams?
Yes, most tools support multiple formats like PDF and PNG.
Are diagramming tools used in software development?
Yes, they are widely used for architecture and UML diagrams.
Do I need design skills?
No, templates make it easy to get started.
Conclusion
Diagramming tools play a crucial role in simplifying complex ideas and improving communication across teams. From enterprise-grade platforms to lightweight open-source tools, the category offers solutions for every use case.