Introduction
Imagine you are driving a car up a steep hill. You notice the engine starting to slow down. Even though the car is still moving forward, you know it is losing steam. Soon, it might stop or roll back down.
Technical analysis in financial markets works in a very similar way. Prices rarely move in a straight line. They surge, slow down, pull back, and push forward again. Traders always look for tools to spot when a strong price move is running out of fuel.
One of the most famous tools for this job is the Relative Strength Index (RSI).
Many beginners hear about RSI and think it is a magic crystal ball that tells you exactly when to buy and sell. Unfortunately, using it that way usually leads to losing money. In this guide, you will learn what RSI actually measures, how it works under the hood, how to read it without getting tricked, and how experienced market participants use it to make better decisions.
What Is the RSI Indicator?
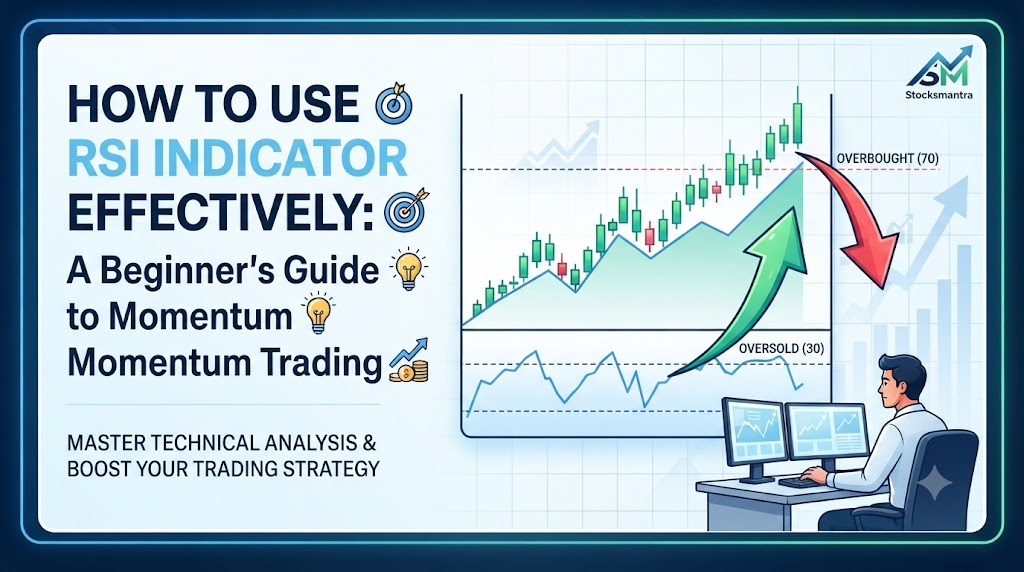
The Relative Strength Index (RSI) is a momentum oscillator. It is a technical analysis tool that measures how fast and how much prices are changing over a specific period.
Created by J. Welles Wilder Jr. in 1978, the RSI appears on a chart as a single line moving up and down inside a fixed window below your main price chart. The scale always runs from 0 to 100.
Simple Meaning
Think of RSI as a speedometer for market excitement.
- When the RSI number is high (above 70), buyers have been pushing prices up very fast. The market might be getting too excited.
- When the RSI number is low (below 30), sellers have been driving prices down very fast. Panic might be taking over.
Why It Matters
Prices can stay irrational longer than you can stay solvent. Just because an asset looks expensive does not mean it will drop immediately. RSI matters because it gives you a mathematical way to look past human emotion and measure whether buying or selling pressure is actually stretching too far.
How the RSI Indicator Works
To use RSI effectively, you need a basic idea of how it is calculated behind the scenes. You do not need to do the math yourself—your trading platform handles that—but knowing the logic prevents you from treating it like black magic.
The Standard Period
By default, most trading platforms set the RSI lookback period to 14.
- On a daily chart, it looks at the price changes over the last 14 days.
- On a 1-hour chart, it looks at the last 14 hours.
The Calculation Logic
The RSI formula compares average gains to average losses over those 14 periods.
- If an asset goes up for 14 straight days with massive green candles, the average gain is huge and the average loss is zero. The RSI shoots up toward 100.
- If the asset crashes for 14 straight days, the average loss is huge and the average gain is zero. The RSI plunges toward 0.
- If gains and losses are balanced, the RSI hovers right around the middle line at 50.
Why Use RSI? (Core Use Cases)
Traders do not just look at whether the line is high or low. They look for specific patterns and behaviors. Here are the three most common ways to use RSI effectively:
1. Identifying Overbought and Oversold Zones
Traditionally, analysts watch two key boundary lines:
- Overbought (Level 70 and above): Buyers have pushed prices very high, very fast. Watch out for a potential pullback or trend reversal.
- Oversold (Level 30 and below): Sellers have pushed prices very low, very fast. Watch out for a potential bounce.
2. Spotting Trend Confirmation
In a strong bull market, prices keep climbing. Interestingly, the RSI will often stay above 50 (frequently touching 70 or higher) for weeks or months. In a strong bear market, RSI will stay below 50. Experienced traders use the 50 centerline to check the overall health of a trend.
3. Finding Divergence (The Secret Weapon)
Divergence happens when the price of an asset and the RSI indicator disagree with each other. This is often where the most reliable signals hide.
- Bullish Divergence: Price makes a lower low (drops further down), but the RSI makes a higher low (stays higher than before). This tells you that downward momentum is fading. Sellers are getting tired. A bounce could be near.
- Bearish Divergence: Price makes a higher high (climbs higher up), but the RSI makes a lower high (stays lower than before). This tells you that upward momentum is fading. Buyers are running out of gas. A drop could be near.
Practical Examples
Let’s look at two simple, hypothetical scenarios to see how this works in the real world.
Example A: The Tech Stock Bounce (Oversold Scenario)
Imagine you are watching shares of a solid technology company. Over the past two weeks, bad news hits the tech sector. The stock falls sharply from $150 to $120.
- You check the RSI. It drops to 22, well below the traditional oversold mark of 30.
- Does this mean you should buy immediately? No.
- Instead, you wait to see if the selling pressure stops. Two days later, the stock drops slightly to $118, but the RSI prints a value of 26, staying higher than its previous low of 22. This is a bullish divergence.
- You treat this as a sign that the panic selling is slowing down, giving you a cleaner entry point to buy.
Example B: The Crypto Rally Warning (Bearish Divergence)
A popular cryptocurrency has been on a massive run, climbing from $1,000 to $2,000 over a month.
- During the final week, the price pushes up to $2,100, setting a new high.
- However, when you look at the RSI, it peaks at 68 during the $2,000 mark, but only reaches 62 during the $2,100 high.
- This is bearish divergence. Even though the price is higher, the momentum is weaker. It tells you that fewer buyers are participating in this final leg up. Smart traders use this warning to take profits rather than buying more at the peak.
Real-World Considerations and Limitations
No technical indicator is perfect. If RSI worked 100% of the time, everyone would be a billionaire. Here is what you need to keep in mind when using it in live markets:
- Strong Trends Break Rules: In a powerful bull market, the RSI can lock itself above 70 for weeks. If you short an asset just because RSI is overbought in a strong trend, you can lose a lot of money as prices keep climbing.
- Lagging Nature: RSI is calculated using past price data. It tells you what has happened, not what will happen with absolute certainty.
- False Signals: Choppy, sideways markets often produce whipsaws—signals that look great on paper but fail immediately because there is no clear trend.
Common Mistakes Beginners Should Make
Learning to trade is as much about avoiding errors as it is about finding good setups. Here are mistakes that trip up many beginners:
- Mistake: Buying or selling solely because the RSI hits 30 or 70.
- Why it happens: It looks like a clear, mechanical rule.
- Why it causes problems: In strong trends, prices can stay overbought or oversold for a very long time.
- What you should do instead: Wait for confirmation. Look for a break of a trendline or a shift in price action before acting on extreme RSI readings.
- Mistake: Ignoring the broader market trend.
- Why it happens: Tunnel vision on the indicator window.
- Why it causes problems: Taking oversold signals in a severe, multi-month bear market is like trying to catch a falling knife.
- What you should do instead: Always check higher-timeframe trends first. Only take counter-trend signals with strict risk controls.
- Mistake: Using too short a time period (like a 3-period RSI).
- Why it happens: Wanting faster signals and more action.
- Why it causes problems: Extremely short periods create massive amounts of noise and false signals.
- What you should do instead: Stick to the standard 14-period setting as a baseline, adjusting only after gaining solid experience.
Decision-Making Framework
To use the RSI indicator effectively without getting trapped by false signals, follow this step-by-step checklist:
- Check the Trend: Look at the main price chart. Is the asset in an uptrend, a downtrend, or moving sideways?
- Identify the Zone: Is the RSI in extreme territory (above 70 or below 30), or is it hovering around the neutral 50 line?
- Look for Divergence: Compare recent price highs and lows with RSI highs and lows. Do they agree, or are they pointing in opposite directions?
- Wait for Confirmation: Never trade an RSI level in isolation. Wait for a candlestick pattern, support/resistance test, or moving average crossover to confirm your thesis.
- Set Your Risk Limits: Decide where your stop-loss will go before entering a trade, ensuring a single bad signal cannot wipe out your account.
Key Terms
- Momentum: The speed or velocity of price movements in a particular direction.
- Oscillator: A technical indicator that moves back and forth across a set scale (like 0 to 100) within a boundary.
- Overbought: A condition where an asset’s price has risen rapidly and may be due for a downward correction.
- Oversold: A condition where an asset’s price has fallen rapidly and may be due for an upward bounce.
- Divergence: A setup where the price action moves in the opposite direction of an indicator like the RSI.
- Lookback Period: The specific number of past periods (candles) the indicator uses to calculate its value.
Frequently Asked Questions
What is the best RSI setting for day trading?
The standard 14-period setting remains the gold standard across almost all timeframes, from 5-minute charts to daily charts. Changing it to shorter periods (like 5 or 9) increases sensitivity but also generates too many false signals.
Can RSI be used alone to make trades?
No. Using RSI by itself is one of the quickest ways to lose money. It should always be used alongside price action, support and resistance levels, and overall trend analysis.
What does an RSI reading of exactly 50 mean?
An RSI of 50 means that over the chosen lookback period, total gains equal total losses. There is no clear momentum advantage for buyers or sellers; the market momentum is entirely neutral.
Why does RSI stay overbought during a strong bull run?
RSI measures the speed of price changes. In a powerful bull run, buying pressure is relentless and continuous. Because prices keep closing higher with strong momentum, the mathematical formula keeps the RSI pinned above 70.
How do I spot false RSI signals?
You can filter out many false signals by trading in the direction of the major trend. If the daily trend is up, ignore overbought warning signals and focus only on buying pullbacks when RSI dips.
Conclusion
The Relative Strength Index is a valuable addition to any trader’s toolkit, provided it is treated with respect and realism. It is not a magic signal generator that tells you when to buy and sell with 100% accuracy. Instead, think of it as a gauge that measures market momentum and exhaustion.
By understanding overbought zones, respecting market trends, watching out for divergences, and avoiding impulsive trades at extreme levels, you can turn the RSI from a confusing line into a practical tool for better decision-making.