Introduction
Imagine walking past two local food stands. The first stand has a long, energetic line of people waiting with cash in hand. The second stand is completely empty, with the owner standing quietly behind the counter. If you had to guess which stand serves better food, you would naturally pick the crowded one.
In the stock market, trading volume is that crowd.
Many beginners make the mistake of looking only at stock charts and price lines. They see a stock price shooting up and rush to buy it. But price alone can be misleading. Smart traders look at volume to see if a price move has real fuel behind it or if it is just a temporary illusion.
This guide will explain what trading volume is, why it matters, how to read it, and how you can use it to make smarter trading decisions without getting trapped by fake market moves.
What Is Volume in Stock Trading?
In simple terms, volume is the total number of shares or contracts traded during a specific time frame, such as one minute, one day, or one week.
If Trader A sells 100 shares of a company and Trader B buys them, the volume for that transaction is 100 shares—not 200. Every trade requires both a buyer and a seller, so we count the total units that changed hands.
Why It Matters
Price tells you where a stock is moving, but volume tells you how much conviction is behind that move. When large institutional investors—like mutual funds, pension funds, or hedge funds—want to buy a stock, they buy massive amounts. This surge in buying creates high volume.
Without volume, price changes are like a feather floating in the wind: they can drift anywhere with very little effort and change direction instantly.
How Trading Volume Works
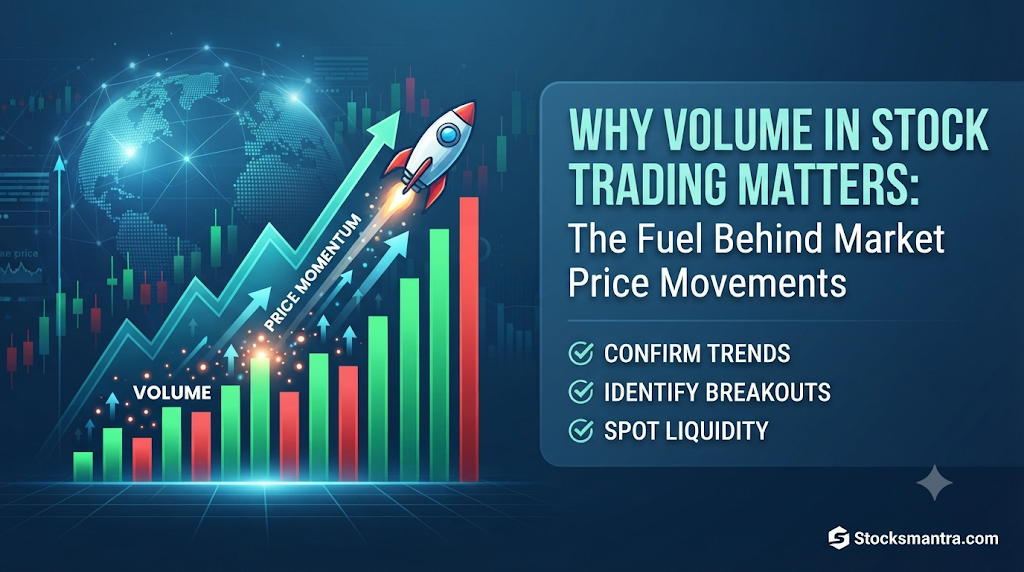
On almost every stock chart, volume is displayed at the very bottom as a series of vertical bars.
- Tall Green Bars: Indicate heavy buying interest during that time period, usually coinciding with a rising stock price.
- Short Red Bars: Indicate low selling or trading activity, often showing that market participants are losing interest.
When a stock breaks out to a new high, you want to see tall volume bars supporting that move. That tells you that a large number of market participants agree that the stock is worth more.
Why Volume is the Ultimate Reality Check
Prices can sometimes move on very little activity. A small group of casual retail traders can push a thinly traded stock up for a brief moment. However, large players cannot hide their money. When millions of shares move at once, it shows real financial commitment.
The Core Relationship Between Price and Volume
- Rising Price + Rising Volume = Strong Trend. Buyers are aggressively entering the market. The trend is healthy and likely to continue.
- Rising Price + Falling Volume = Weak Trend. The price is going up, but fewer people care. This is often a warning sign that the rally is running out of steam.
- Falling Price + Rising Volume = Strong Selling Pressure. Panic or heavy institutional selling is driving the price down.
- Falling Price + Falling Volume = Lack of Interest. Sellers are fading away, and no one is stepping in to buy just yet.
Practical Examples: Reading the Crowd
Let us look at two real-world scenarios to see how volume changes the meaning of a price chart.
Scenario A: The Healthy Breakout
Imagine Company XYZ has been trading at $50 for months. Suddenly, positive earnings news drops. The price jumps to $55 by noon. When you check the volume bar, it is five times larger than its daily average.
- What it means: The market is reacting heavily to the news. Big buyers are stepping in aggressively. This breakout is backed by real capital.
Scenario B: The Fakeout Trap
Now imagine Company ABC slowly drifts up from $50 to $55 over a week, but the volume bars get smaller and smaller each day.
- What it means: The upward push is happening in an empty room. There are no heavy buyers supporting the price. Soon, a few profit-takers sell their shares, and because there is no buying support, the price crashes back down. This is called a fakeout.
Common Mistakes Beginners Make
Trading volume is powerful, but misreading it can cost you money. Here are some common mistakes to avoid:
- Ignoring the average: Looking at a single volume bar without comparing it to the stock’s average daily volume. A “high” volume day for a small company might be considered a very quiet day for a massive company like Apple.
- Chasing low-volume breakouts: Buying a stock that jumps in price on very thin volume, hoping it will keep climbing, only to watch it collapse immediately.
- Treating volume as a standalone tool: Using volume by itself without checking overall market trends, company news, or support and resistance levels.
Risks and Limitations
Volume is not a crystal ball. It has limitations that every trader must understand:
- Manipulated markets: In very small, low-priced stocks (often called penny stocks), bad actors can artificially create the illusion of high volume through coordinated trading, trapping unwary buyers.
- Lagging signals: Volume confirms what is happening now or what just happened; it does not always predict the exact future turn of events.
- News shocks: Sudden unexpected news (like a sudden legal penalty or CEO resignation) can cause massive volume spikes instantly, catching traders off guard before they can react.
Key Terms
- Volume: The total number of shares traded during a given timeframe.
- Liquidity: How easily a stock can be bought or sold without causing a massive swing in its price. High volume usually means high liquidity.
- Fakeout: A price movement that looks like a genuine trend breakout but quickly reverses due to a lack of volume support.
- Institutional Investors: Large organizations like banks, insurance funds, and mutual funds that trade massive blocks of shares and drive major market volume.
- Accumulation: A phase where large players quietly buy up shares over time without driving the price up too fast, often seen as flat prices with steady volume patterns.
FAQs
Can a stock go up if the volume is low?
Yes. If there are very few sellers, even a small amount of buying can push the price up. However, these upward moves are fragile and often reverse quickly because they lack broad market support.
Where can I find volume data on stock charts?
Volume is a standard feature on nearly all financial websites, trading apps, and charting software. It almost always appears directly beneath the main price chart as color-coded vertical bars.
What is “Average Daily Volume” (ADV)?
ADV is the average number of shares traded per day over a specific period, usually 30 or 90 days. It helps you understand what counts as “normal” activity for that specific stock.
Is high volume always a good sign?
Not necessarily. High volume accompanied by a sharp drop in stock price indicates heavy selling pressure and panic, which is a bearish signal for current holders.
Do day traders and long-term investors both use volume?
Yes. Day traders use volume to spot immediate intraday momentum and liquidity. Long-term investors use volume to verify whether major institutions are accumulating shares over weeks or months.
Conclusion
Price shows you where a stock is heading, but volume shows you whether anyone is actually following. By paying attention to volume, you stop guessing based on price lines alone and start seeing the real money and conviction driving the market. Always look for volume confirmation before trusting a big market move, and remember that simple, patient observation beats chasing empty price spikes every single time.